

Question: MA135 Statistical Applications Final Project Part 2 Name: Title: Type your approved research question here: Part 2: Summary Statistics & Statistical Analysis Summary Statistics of
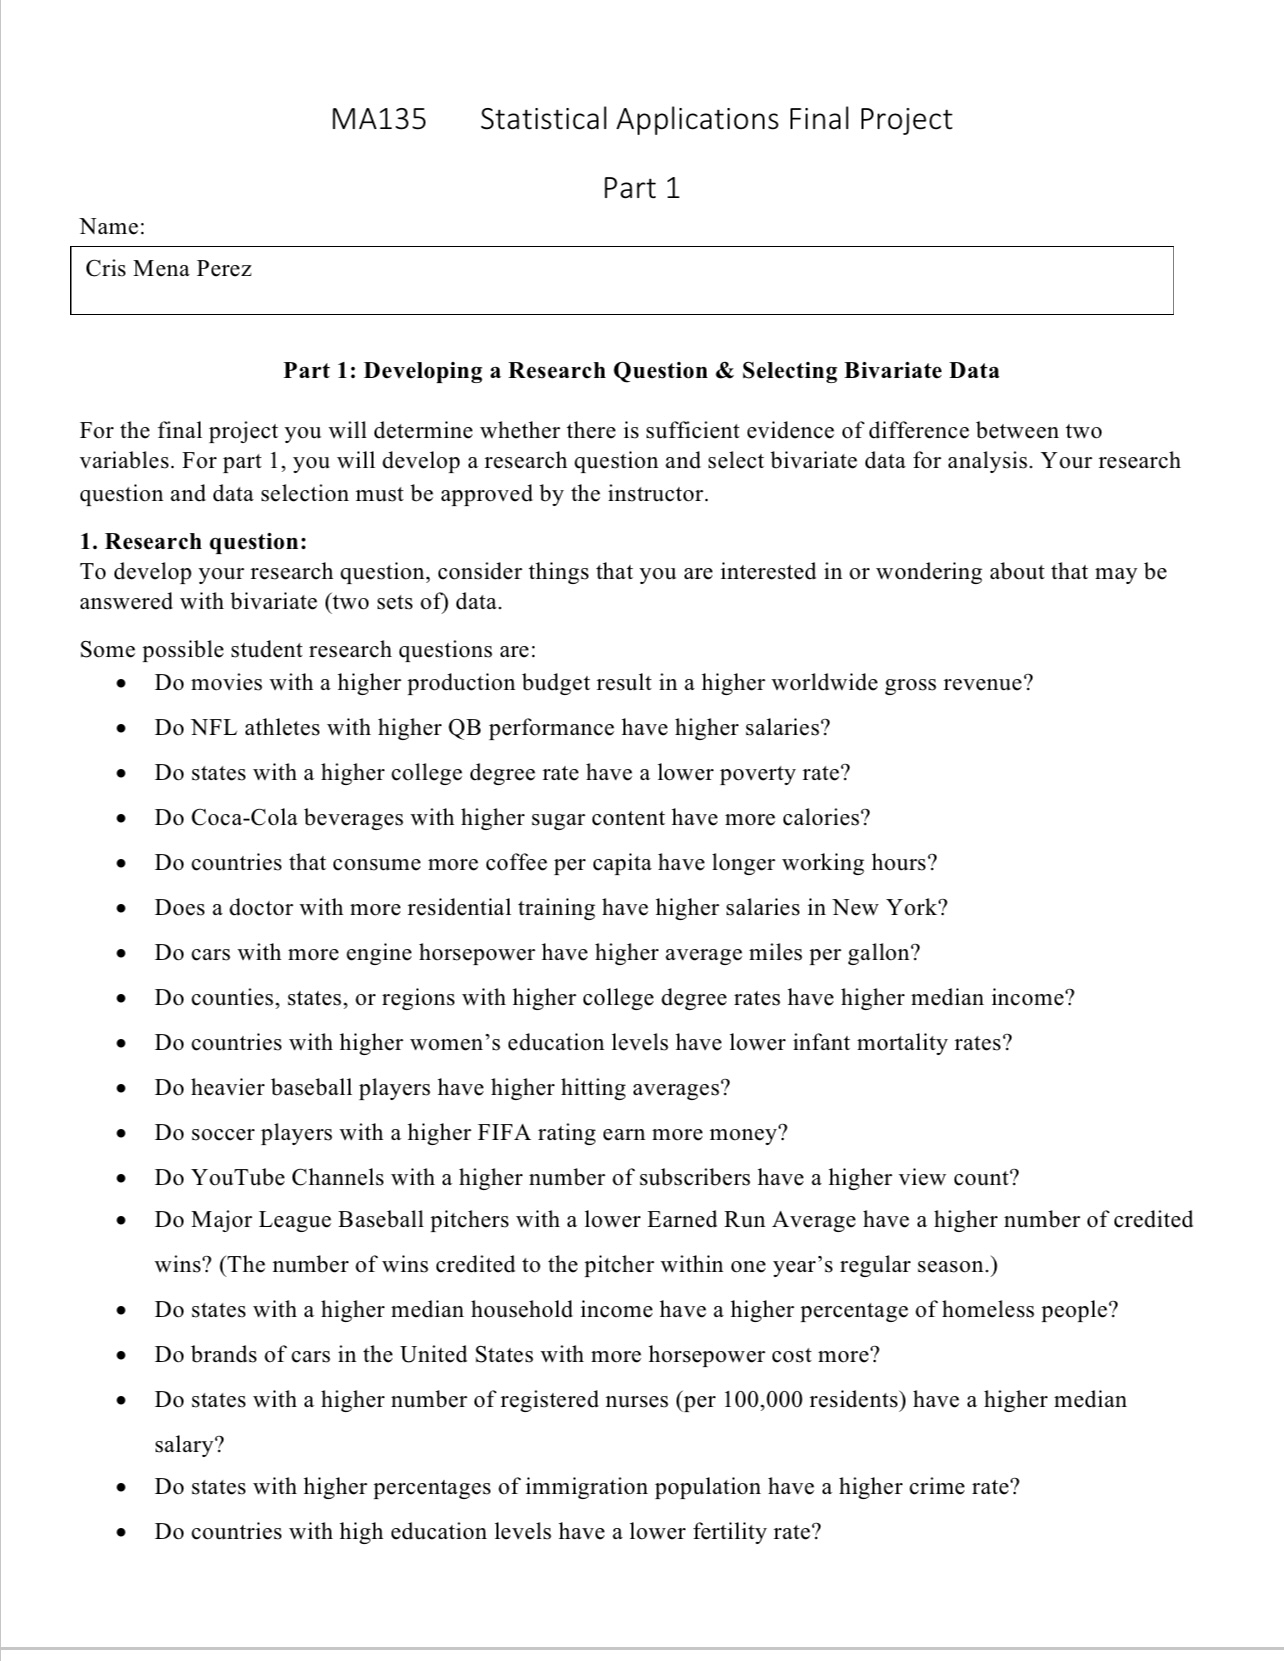
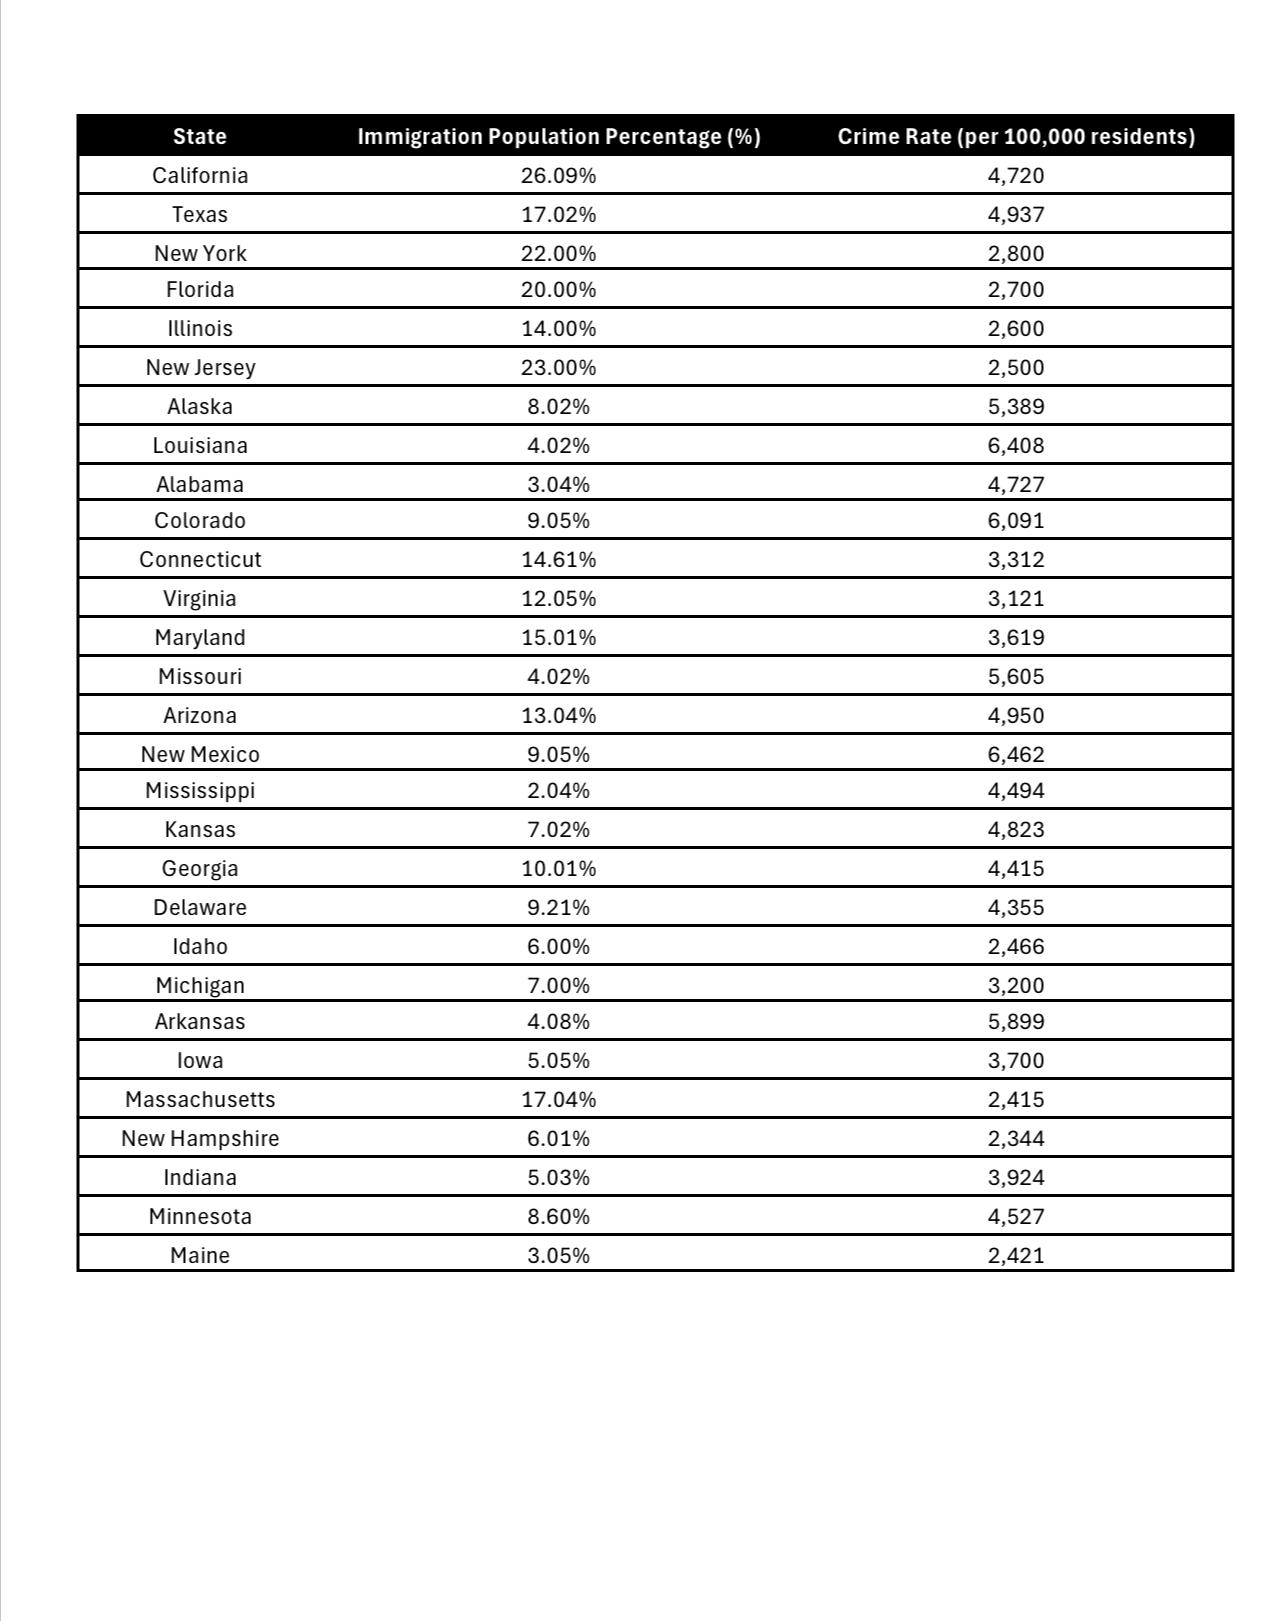
MA135 Statistical Applications Final Project Part 2 Name: Title: Type your approved research question here: Part 2: Summary Statistics & Statistical Analysis Summary Statistics of the Independent Variable (x) Your part 1 must be approved before you begin part 2. 1. Data selection methodology In statistics, how the sample is obtained for data analysis is important. Explain how you obtained or selected your data. Did you choose all the data because it is comprehensive of your data sets (example: all 50 states)? Did you to delete some values because it was missing? Was your data selected because it meets the criteria? What is your sample size? 2. Independent Variable (x & a. Identify the Independent Variable (x): Write the name that you used to label the independent variable in Excel b. Describe and explain the independent variable in a complete sentence with units and years if applicable. Use the wording from the data source (website). 3. Measures of Center of the Independent Variable (x) a. You may paste the summary statics table from Excel below for the independent variable. Adjust the font size if necessary. ~optional~ b. Determine the mean, median, and midrange of the independent variable. Include units. Carry one more decimal place than is present in the original set of values. /Chapter 3} Mean: Median: Midrange: 4. Measures of Variation of the Independent Variable (x a. Determine the range, standard deviation, and variance of the independent variable. Include units. Carry one more decimal place than is present in the original set of values. [Chapter 4} Range: Standard Deviation: Variance: 5. Measures of Relative Standing of the Independent Variable (x) a. Identify the measures of the independent variable. Include units. Minimum: Median: Maximum: b. Determine the data point that has the minimum and maximum values in your independent variables column. With Minimum Value: With Maximum Value: | 6. Analysis Describe the independent variable in a short paragraph based on your analysis of the data. Bonus: Include graphs. Summary Statistics of the Dependent Variable (v) 1. Dependent (response) Variable (y) a. Identify the dependent variable (y): Write the name that you used to label the dependent variable. b. Describe and explain the dependent variable in a complete sentence with units and years if applicable. Use the wording from the data source (website). 2. Measures of Center of the Dependent Variable (y a. You may paste the summary statics table below for the dependent variable. Adjust the font size if necessary. ~optional~ b. Determine the mean, median, and midrange of the dependent variable. Include units. Carry one more decimal place than is present in the original set of values. {Chapter 3} 3. Measures of Variation of the Dependent Variable (3 { a. Determine the range, standard deviation, and variance of the dependent variable. Include units. Carry one more decimal place than is present in the original set of values. {Chapter 4} Standard Deviation: Variance: - ] 4. Measures of Relative Standing of the Dependent Variable (y) a. Identify each value below. Include units. Minimum Median: Maximum: b. Determine the data point that has the minimum and maximum values in your dependent variables column. With Minimum Value: With Maximum Value: c. Separate the data for your dependent variable into two groups based on a designation of your independent variable For example, Group one can be for any 15 values that correspond to the lower levels of the independent variable and Group two can be for the other 15 values that correspond to the higher levels of the independent variable. /Chapter 4} Group One Group Two N= N= M= M= SS= SS = 5. Analysis a. Describe the dependent variable in a short paragraph (at least three sentences) based on your analysis of the data. Bonus: Include graphs Hypothesis Testing 1. Hypothesis Test Test the claim that there is a significant difference for your independent (x) variable between the two groups of the dependent (y) variable. a. State the null and alternative hypothesis. [Chapter 8} b. Find the pooled variance for the two groups. {Chapter 10} c. Compute the standard error of the difference between the means of the two groups. /Chapter 10} d. Hypothesis Test Based on the t-Test using a a@ =0.01 significance level. e. Write a statement stating whether there is significant difference between the two groups as related to the independent and the dependent variables. f. Write 2 or more paragraphs stating your conclusions, observations, analysis, and evaluation. Reflect on your work too. Name: MA135 Statistical Applications Final Project Part 1 Cris Mena Perez Part 1: Developing a Research Question & Selecting Bivariate Data For the final project you will determine whether there is sufficient evidence of difference between two variables. For part 1, you will develop a research question and select bivariate data for analysis. Your research question and data selection must be approved by the instructor. 1. Research question: To develop your research question, consider things that you are interested in or wondering about that may be answered with bivariate (two sets of) data. Some possible student research questions are: . Do movies with a higher production budget result in a higher worldwide gross revenue? Do NFL athletes with higher QB performance have higher salaries? Do states with a higher college degree rate have a lower poverty rate? Do Coca-Cola beverages with higher sugar content have more calories? Do countries that consume more coffee per capita have longer working hours? Does a doctor with more residential training have higher salaries in New York? Do cars with more engine horsepower have higher average miles per gallon? Do counties, states, or regions with higher college degree rates have higher median income? Do countries with higher women's education levels have lower infant mortality rates? Do heavier baseball players have higher hitting averages? Do soccer players with a higher FIFA rating earn more money? Do YouTube Channels with a higher number of subscribers have a higher view count? Do Major League Baseball pitchers with a lower Earned Run Average have a higher number of credited wins? (The number of wins credited to the pitcher within one year's regular season.) Do states with a higher median household income have a higher percentage of homeless people? Do brands of cars in the United States with more horsepower cost more? Do states with a higher number of registered nurses (per 100,000 residents) have a higher median salary? Do states with higher percentages of immigration population have a higher crime rate? Do countries with high education levels have a lower fertility rate? Do states with higher Flu Vaccine Rates have lower Influenza/Pneumonia death rates? Do states with higher median household income have lower violent crime rates? Type your research question here: Do states with higher percentages of immigration population have a higher crime rate? 2. Data selection and source Below is a list of websites students may use to obtain data. There are tons of resources where you can obtain real data. You may use other sites, but make sure that it is a legitimate website. Finding good data to analyze will take a good amount of time so plan ahead! https://www.data.gov/ https://www.census.gov/data.html https://www.cia.gov/library/publications/resources/the-world-factbook/appendix/appendix-e.html https://www.healthdata.gov/ https://www.cdc.gov/datastatistics/index.html http://www.gapminder.org/data/ http://www.pewinternet.org/datasets/ https://stats.nba.com/ http://mlb.mlb.com/stats/ http://hdr.undp.org/en/data http://www.espn.com/ https://www.glassdoor.com/Salries/index.htm https://www.aamc.org/ https://ourworldindata.org/Y our sample size should be comprehensive. For example, you should have a minimum of n=30 for your data to be comprehensive. Remember that each data point needs two variables (dependent and independent variables). The data must be quantitative. Once you decide on a data set, ask for approval. Download, copy and paste the data it into Excel. You need three columns in Excel clearly labeled with units: Ex: (State names, median income ($), Homeless percentage of state population) a. Enter the website or source you obtained your data from: https://www.census.gov/data.html https://www.fbi.gov/services/cjis/ucr b. Explain how you selected the data: The percentage of the population that is immigrants. The crime rate. Determining the Independent and Dependent Variables: Decide how you will ask your research question. For example, a researcher may question whether countries with higher education for women have lower child mortality rates. The researcher may have asked this because s/he wanted to test the claim that that women's education may have an effect on child mortality rates. Therefore, women's education is the independent variable and child mortality rates is the dependent variable. 3. Independent (predictor) Variable (x) a. Identify the Independent Variable (x): Write the name that you will use to label the independent variable in Excel. Immigration Population Percentage b. Describe and explain the independent variable in a complete sentence with units and years, if applicable. Use the wording from the data source. The proportion of immigrants in each states population as recorded by the U_S. Census Bureau for 2020. Is the independent variable. 4. Dependent (response) Variable (v) a. Identify the dependent variable (y): Write the name that you will use to label the dependent variable in Excel. Crime Rate b. Describe and explain the dependent variable in a complete sentence with units and years, if applicable. Use the wording from the data source. The crime rate, as reported by the FBI Uniform Crime Reporting (UCR) Program for the year 2020, is the dependent variable. It is calculated as the number of reported crimes per 100,000 residents in each state. Submit this document and Excel file of your data (with three columns clearly labeled with name of the data point, independent variable with units, dependent variable with units) State Immigration Population Percentage (%) Crime Rate (per 100,000 residents) California 26.09% 4,720 Texas 17.02% 4,937 New York 22.00% 2,800 Florida 20.00% 2,700 Illinois 14.00% 2,600 New Jersey 23.00% 2,500 Alaska 8.02% 5,389 Louisiana 4.02% 6,408 Alabama 3.04% 4,727 Colorado 9.05% 5,091 Connecticut 14.61% 3,312 Virginia 12.05% 3,121 Maryland 15.01% 3,619 Missouri 4.02% 5,605 Arizona 13.04% 4,95 New Mexico 9.05% 6,462 Mississippi 2.04% 1,494 ansas 7.02% 1,823 Georgia 10.01% 4,415 Delaware 9.21% 4,355 daho 6.00% 2,466 Michigan 7.00% 3,200 Arkansas 4.08% 5.899 owa 5.05% 3,700 Massachusetts 17.04% 2,415 New Hampshire 6.01% 2,344 Indiana 5.03% 3,924 Minnesota 8.60% 4,527 Maine 3.05% 2,421
Step by Step Solution
There are 3 Steps involved in it
To proceed with your analysis follow these steps Summary Statistics Statistical Analysis 1 Data Selection Methodology Sample Selection Explain that yo... View full answer

Get step-by-step solutions from verified subject matter experts