

Question: 0 Question 7' v Adotplot is a type of graph that looks like a histogram but where each class is just a single value as
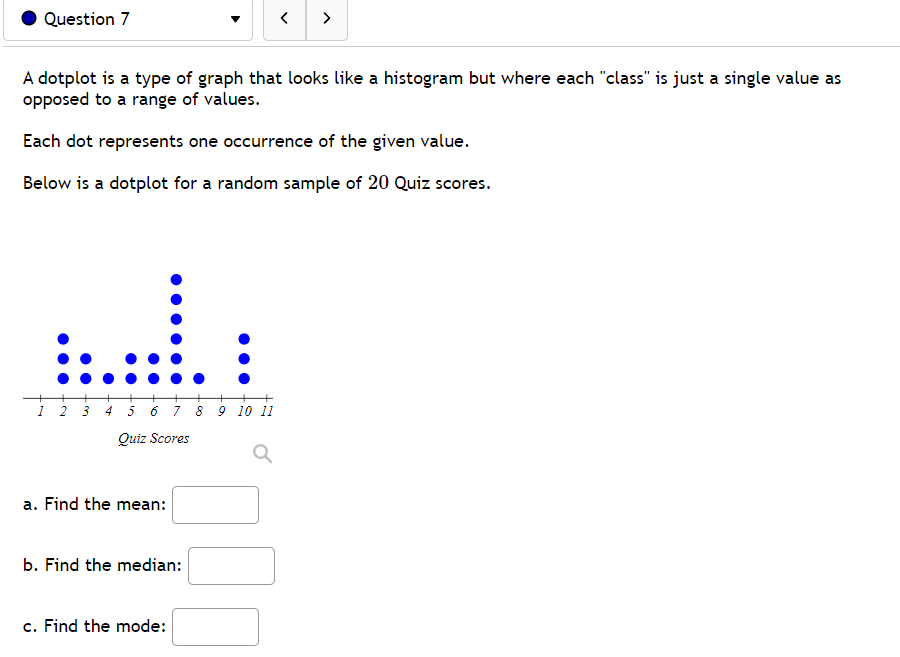
0 Question 7' v Adotplot is a type of graph that looks like a histogram but where each "class" is just a single value as opposed to a range of values. Each dot represents one occurrence of the given value. Below is a dotplot for a random sample of 20 Quiz scores. 123456?8910H Quiz Scores Q a. Find the mean: C] b. Find the median: C] c. Find the mode: C]
Step by Step Solution
There are 3 Steps involved in it
1 Expert Approved Answer
Step: 1 Unlock

Question Has Been Solved by an Expert!
Get step-by-step solutions from verified subject matter experts
Step: 2 Unlock
Step: 3 Unlock