

Question: . Question 18 A dotplot is a type of graph that looks like a histogram but where each class is just a single value as
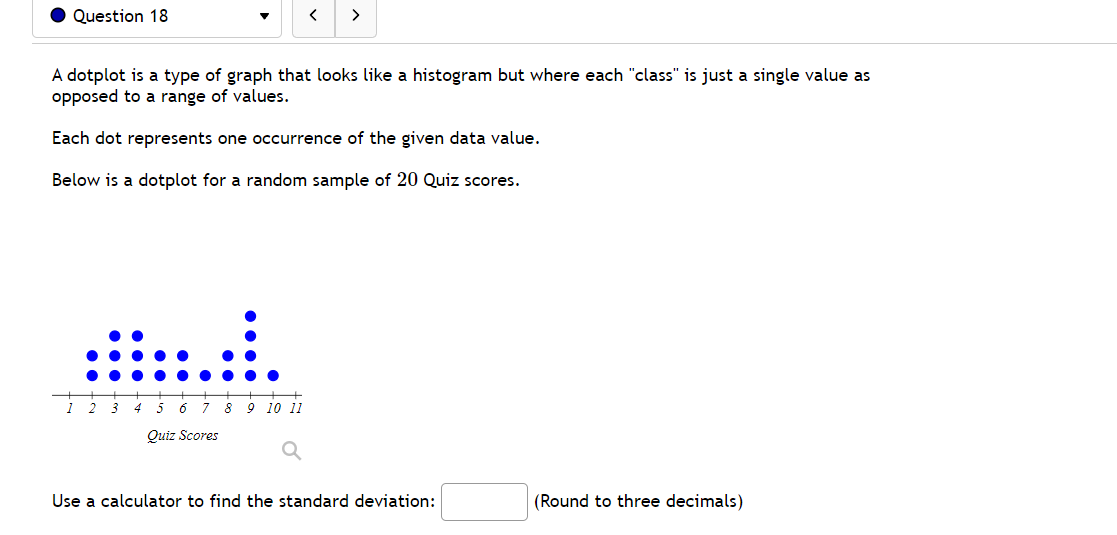
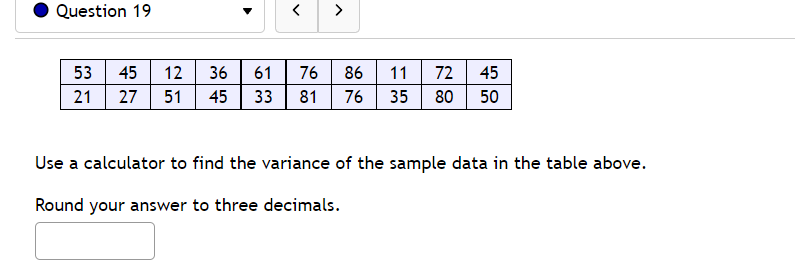


. Question 18 A dotplot is a type of graph that looks like a histogram but where each "class" is just a single value as opposed to a range of values. Each dot represents one occurrence of the given data value. Below is a dotplot for a random sample of 20 Quiz scores. 1 2 3 4 5 6 7 8 9 10 1 1 Quiz Scores Use a calculator to find the standard deviation: (Round to three decimals)0 Question 19 v 53 45 12 36 61 76 36 11 7'2 45 21 2? 51 45 33 B1 76 35 80 50 Use a calculator to find the variance of the sample data in the table above. Round your answer to three decimals. :1
Step by Step Solution
There are 3 Steps involved in it
1 Expert Approved Answer
Step: 1 Unlock

Question Has Been Solved by an Expert!
Get step-by-step solutions from verified subject matter experts
Step: 2 Unlock
Step: 3 Unlock