

Question: 0 Question 9 v E The graph illustrates a normal distribution for the prices paid for a particular model of HD television. The mean price
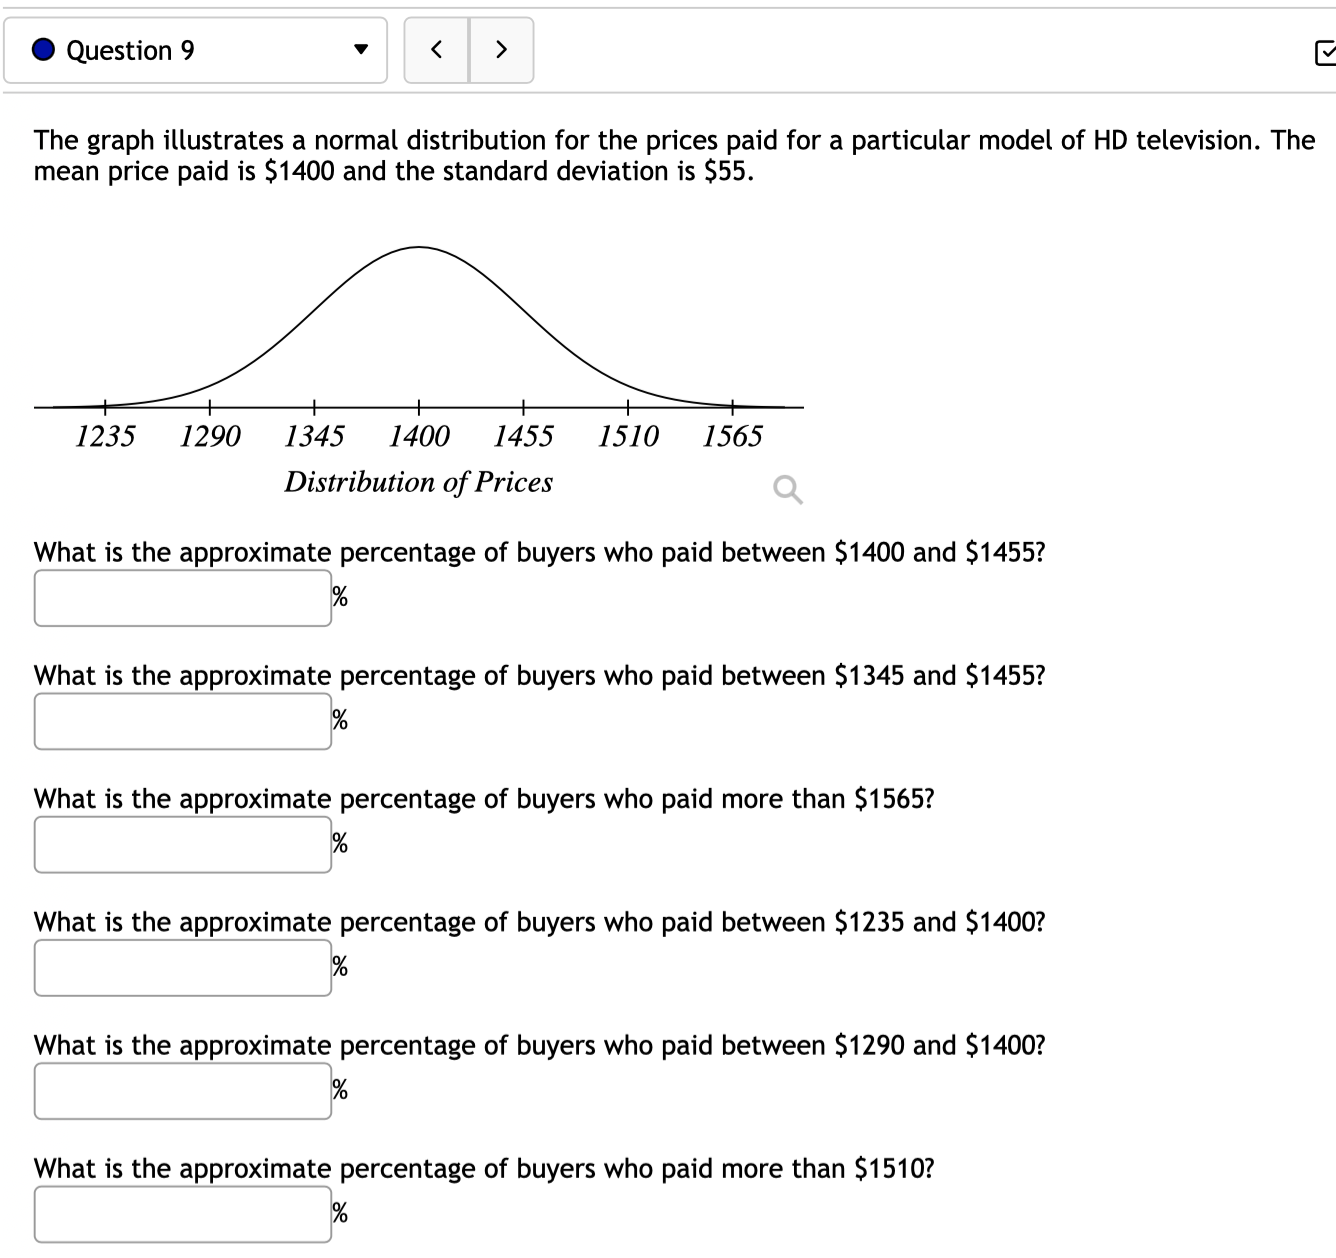
0 Question 9 v E The graph illustrates a normal distribution for the prices paid for a particular model of HD television. The mean price paid is $1400 and the standard deviation is $55. 1235 1290 1345 1400 1455 1510 1565 Distribution of Prices Q What is the approximate percentage of buyers who paid between $1400 and 51455? What is the approximate percentage of buyers who paid between $1345 and $1455? What is the approximate percentage of buyers who paid more than 51565? What is the approximate percentage of buyers who paid between $1235 and 51400? What is the approximate percentage of buyers who paid between $1290 and 51400? What is the approximate percentage of buyers who paid more than $1510
Step by Step Solution
There are 3 Steps involved in it

Get step-by-step solutions from verified subject matter experts