

Question: 0 Question to answer in discussion Part one Write these model parameter values in a table and then describe their sensitivity (using Sensitivity dialogue) in
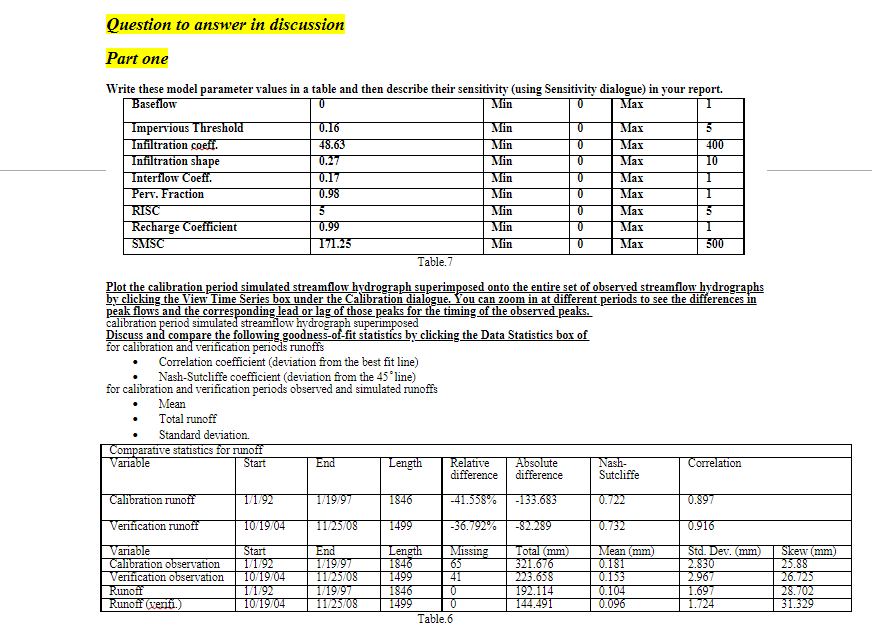
0 Question to answer in discussion Part one Write these model parameter values in a table and then describe their sensitivity (using Sensitivity dialogue) in your report. Baseflow 0 Min Max Impervious Threshold 0.16 Min 0 Max 5 Infiltration coeff. 48.63 Min 0 Max 400 Infiltration shape 0.27 Min 0 Max 10 Interflow Coeff. 0.17 Min 0 Max 1 Perv. Fraction 0.98 Min 0 Max 1 RISC 5 Min 0 Max 5 Recharge Coefficient 0.99 Min 0 Max 1 SAMSC 171.25 Vin 0 Max 500 Table 7 Plot the calibration period simulated streamflow hydrograph superimposed onto the entire set of observed streamflow hydrographs by clicking the View Time Series box under the Calibration dialogue. You can zoom in at different periods to see the differences in peak flows and the corresponding lead or lag of those peaks for the timing of the observed peaks. calibration period simulated streamflow hydrograph superimposed Discuss and compare the following goodness-of-fit statistics by clicking the Data Statistics box of for calibration and verification periods runoffs Correlation coefficient deviation from the best fit line) Nash-Sutcliffe coefficient (deviation from the 45'line) for calibration and verification periods observed and simulated runoffs Mean Total runoff Standard deviation Comparative statistics for runoff Variable Start End Length Relative Absolute Nash- Correlation difference difference Sutcliffe Calibration runoff 17192 119797 1846 -41.558% -135.683 0.722 0.897 Verification runoft 10/19704 1125708 1499 -36.792% -82289 0.732 0.916 Variable Start End Length Missing Total (mm) Mean (mm) Std. Dev. mm Calibration observation 11792 119797 1846 65 321.676 0.181 2.850 Verification Observation 10 19704 11725708 1499 41 223.658 0.153 2.967 Runott 11792 1/19797 1846 0 192.114 0.104 1.697 Runoff (veriti.) 10/19704 1125708 1499 0 144.491 0.096 1.724 Table 6 Skew (mm) 25.88 26.725 28.702 31.329 0 Question to answer in discussion Part one Write these model parameter values in a table and then describe their sensitivity (using Sensitivity dialogue) in your report. Baseflow 0 Min Max Impervious Threshold 0.16 Min 0 Max 5 Infiltration coeff. 48.63 Min 0 Max 400 Infiltration shape 0.27 Min 0 Max 10 Interflow Coeff. 0.17 Min 0 Max 1 Perv. Fraction 0.98 Min 0 Max 1 RISC 5 Min 0 Max 5 Recharge Coefficient 0.99 Min 0 Max 1 SAMSC 171.25 Vin 0 Max 500 Table 7 Plot the calibration period simulated streamflow hydrograph superimposed onto the entire set of observed streamflow hydrographs by clicking the View Time Series box under the Calibration dialogue. You can zoom in at different periods to see the differences in peak flows and the corresponding lead or lag of those peaks for the timing of the observed peaks. calibration period simulated streamflow hydrograph superimposed Discuss and compare the following goodness-of-fit statistics by clicking the Data Statistics box of for calibration and verification periods runoffs Correlation coefficient deviation from the best fit line) Nash-Sutcliffe coefficient (deviation from the 45'line) for calibration and verification periods observed and simulated runoffs Mean Total runoff Standard deviation Comparative statistics for runoff Variable Start End Length Relative Absolute Nash- Correlation difference difference Sutcliffe Calibration runoff 17192 119797 1846 -41.558% -135.683 0.722 0.897 Verification runoft 10/19704 1125708 1499 -36.792% -82289 0.732 0.916 Variable Start End Length Missing Total (mm) Mean (mm) Std. Dev. mm Calibration observation 11792 119797 1846 65 321.676 0.181 2.850 Verification Observation 10 19704 11725708 1499 41 223.658 0.153 2.967 Runott 11792 1/19797 1846 0 192.114 0.104 1.697 Runoff (veriti.) 10/19704 1125708 1499 0 144.491 0.096 1.724 Table 6 Skew (mm) 25.88 26.725 28.702 31.329
Step by Step Solution
There are 3 Steps involved in it

Get step-by-step solutions from verified subject matter experts