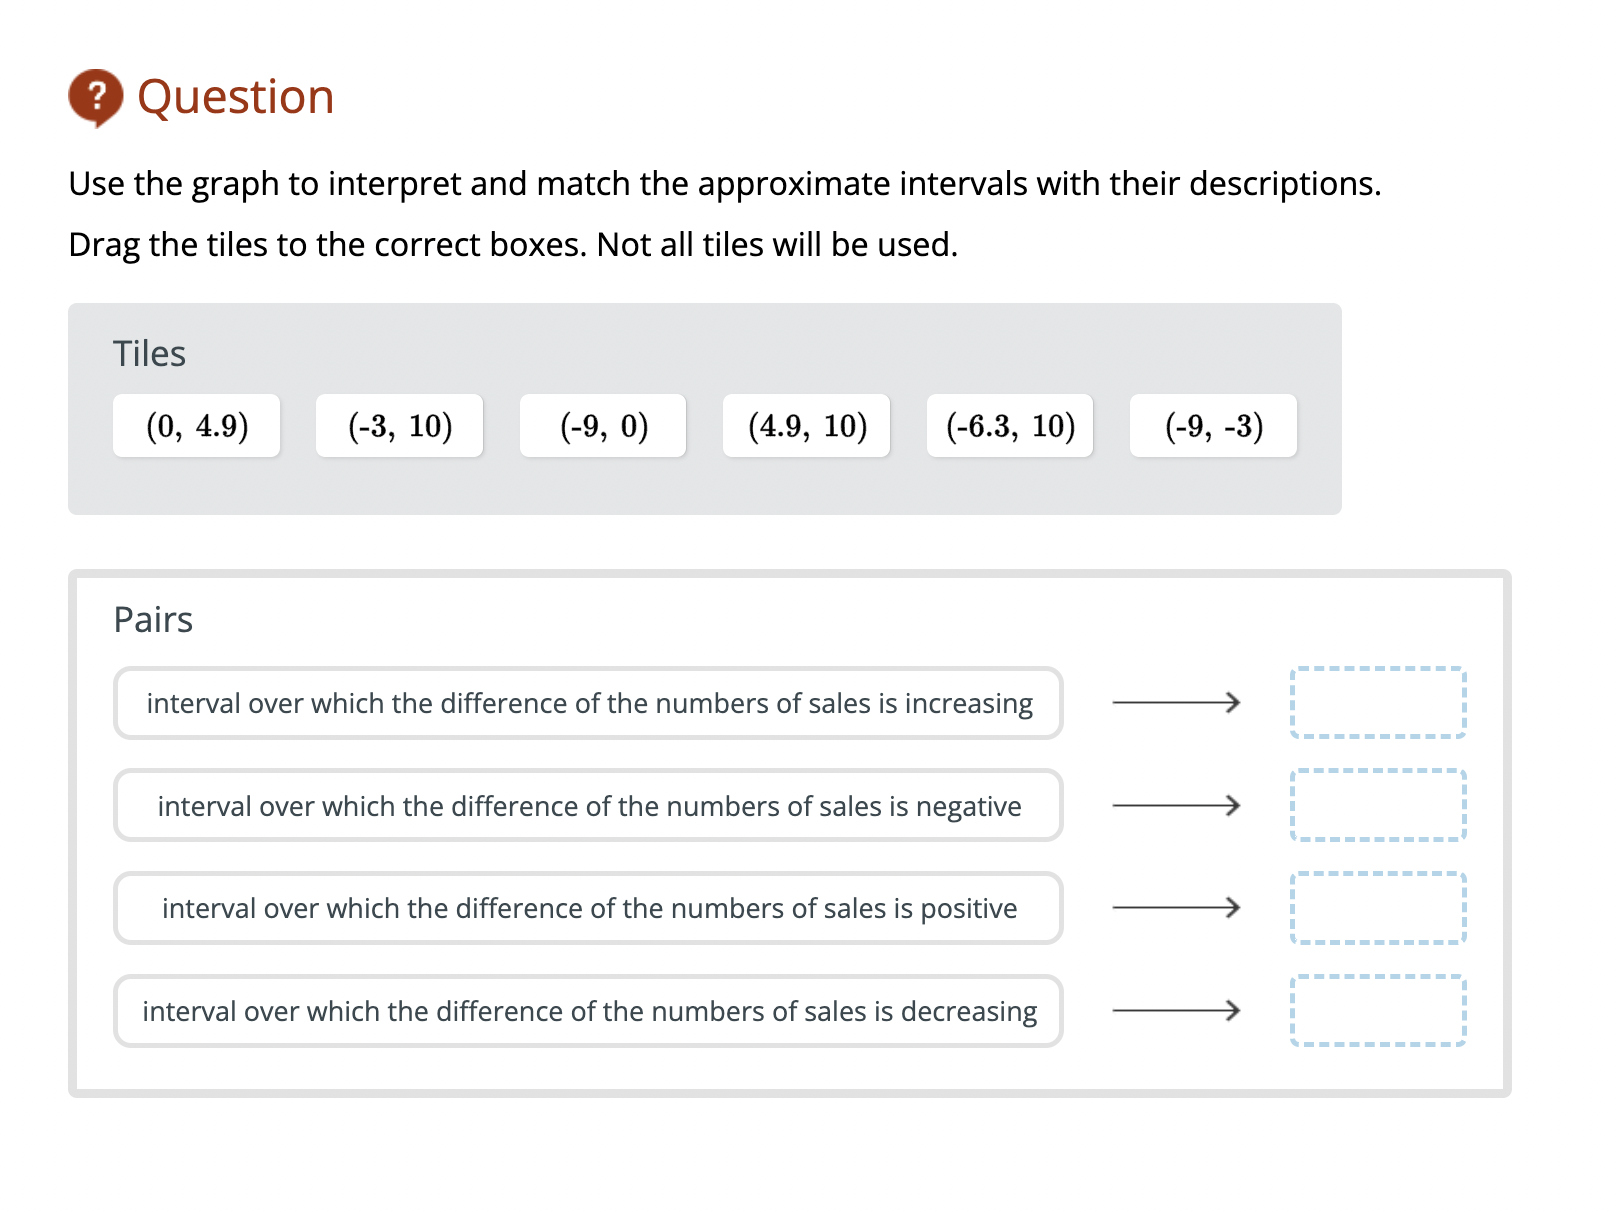
Question: 0 Question Use the graph to interpret and match the approximate intervals with their descriptions. Drag the tiles to the correct boxes. Not all tiles

0 Question Use the graph to interpret and match
0 Question Use the graph to interpret and match the approximate intervals with their descriptions. Drag the tiles to the correct boxes. Not all tiles will be used. Tiles (0, 4.9) (-3, 10) (-9, 0) (4.9, 10) (-6.3, 10) (-9, -3) Pairs interval over which the difference of the numbers of sales is increasing > interval over which the difference of the numbers of sales is negative > interval over which the difference of the numbers of sales is positive > interval over which the difference of the numbers of sales is decreasing >

Step by Step Solution

There are 3 Steps involved in it

1 Expert Approved Answer
Step: 1 Unlock blur-text-image
Question Has Been Solved by an Expert!

Get step-by-step solutions from verified subject matter experts

Step: 2 Unlock
Step: 3 Unlock

Students Have Also Explored These Related Mathematics Questions!