Question: 0 X Dataset assignment (1) - Cluster.sav [DataSet1] - IBM SPSS Statistics Data Editor File Edit View Data Transform Analyze Graphs Utilities Extensions Window Help
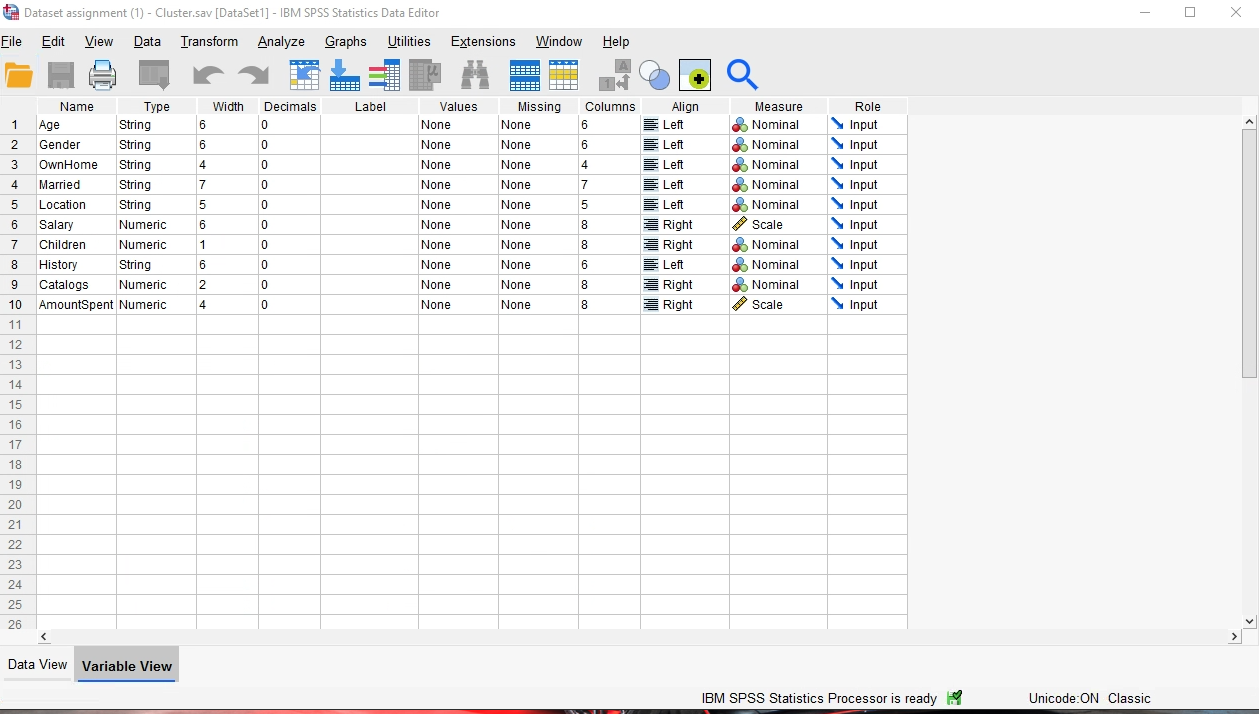
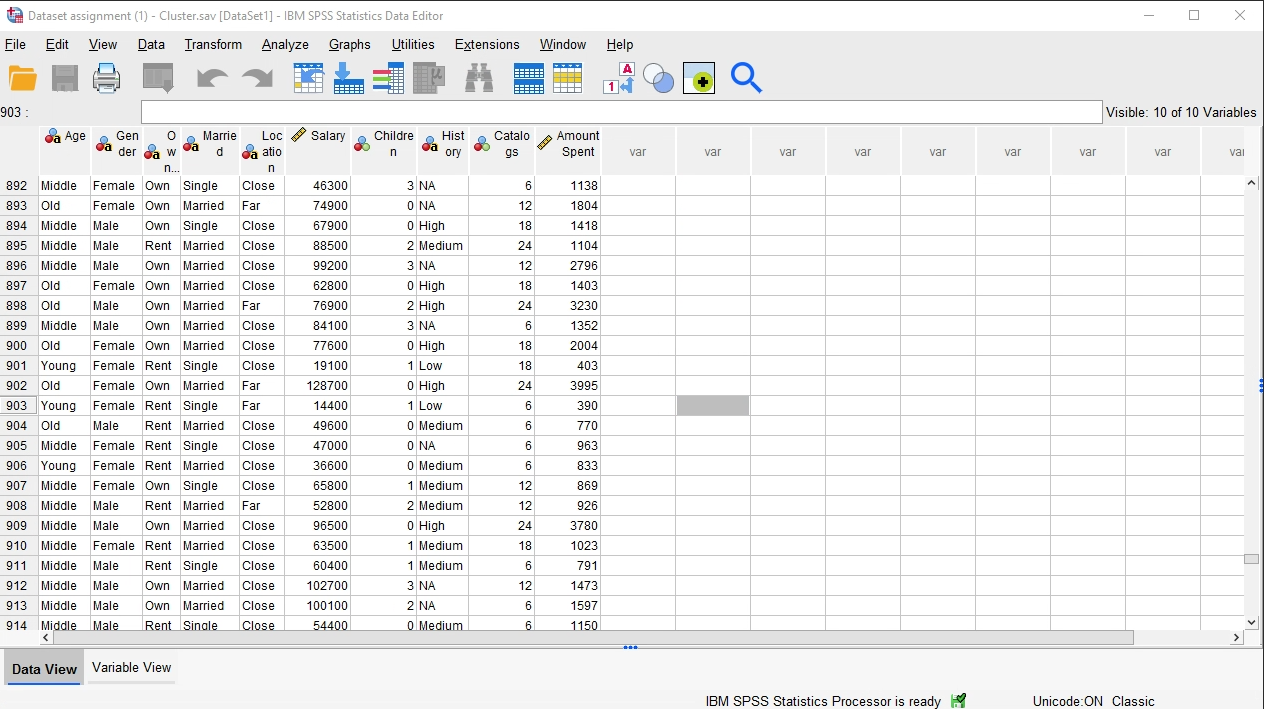
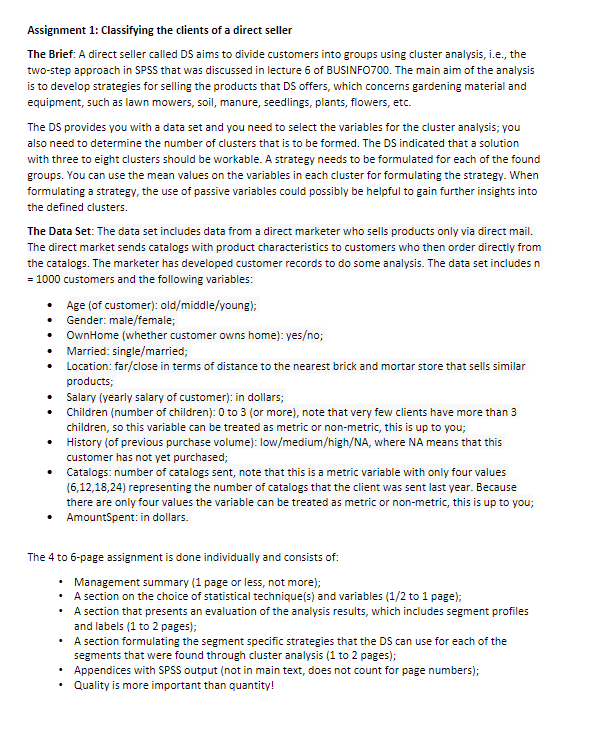
0 X Dataset assignment (1) - Cluster.sav [DataSet1] - IBM SPSS Statistics Data Editor File Edit View Data Transform Analyze Graphs Utilities Extensions Window Help + Name Type Width Decimals Label Values Missing Columns Align Measure Role String 0 None 6 Input 1 Age None Left Nominal Input Gender String None None 6 : Left Nominal OwnHome String None None Left Nominal Input 4 7 Input Married String None None : Left Nominal Location String 10 None None 5 Left Nominal Input 8 Input Salary Numeric 0 None None Right Scale 7 Children Numeric None None 8 Right Nominal Input 8 History String None None Left Nominal Input Numeric None None Right Nominal Input 9 Catalogs AmountSpent Numeric None 8 10 None Right Scale Input 11 12 13 14 15 16 17 18 19 20 21 22 23 24 25 26 Data View Variable View IBM SPSS Statistics Processor is ready . Unicode:ON ClassicDataset assignment (1) - Cluster.sav [DataSet1] - IBM SPSS Statistics Data Editor 0 X File Edit View Data Transform Analyze Graphs Utilities Extensions Window Help A + 903 : Visible: 10 of 10 Variables da Age Gen O Marrie Loc Salary Childre Hist Catalo Amount oa der da W da d da atio n oa ory gs Spent var var var var var var var var val 892 Middle Female Own Single Close 46300 3 NA 6 1138 893 Old Female Own Married Far 74900 O NA 12 1804 894 Middle Male Own Single Close 67900 0 High 18 1418 895 Middle Male Rent Married Close 88500 2 Medium 24 1104 896 Middle Male Own Married Close 99200 3 NA 12 2796 897 Old Female Own Married Close 62800 0 High 18 1403 898 Old Male Own Married Far 76900 2 High 24 3230 9 Middle Male Own Married Close 84100 3 NA 6 1352 900 Old Female Own Married Close 77600 0 High 18 2004 901 Young Female Rent Single Close 19100 1 Low 18 403 902 Old Female Own Married Far 128700 0 High 24 3995 903 Young Female Rent Single Far 14400 1 Low 6 390 904 Old Male Rent Married Close 49600 0 Medium 6 770 905 Middle Female Rent Single Close 47000 O NA 6 963 906 6 Young Female Rent Married Close 36600 0 Medium 6 833 907 Middle Female Own Single Close 65800 1 Medium 12 869 908 Middle Male Rent Married Far 52800 2 Medium 12 926 909 Middle Male Own Married Close 96500 0 High 24 3780 910 Middle Female Rent Married Close 63500 1 Medium 18 1023 911 Middle Male Rent Single Close 60400 1 Medium 6 791 912 Middle Male Own Married Close 102700 3 NA 12 1473 913 Middle Male Own Married Close 100100 2 NA 6 1597 914 Middle Male Rent Single Close 54400 0 Medium 6 1150 Data View Variable View IBM SPSS Statistics Processor is ready Unicode:ON ClassicAssignment 1: Classifying the clients of a direct seller The Brief: A direct seller called DS aims to divide customers into groups using cluster analysis, i.e., the two-step approach in SPSS that was discussed in lecture 6 of BUSINFO700. The main aim of the analysis is to develop strategies for selling the products that DS offers, which concerns gardening material and equipment, such as lawn mowers, soil, manure, seedlings, plants, flowers, etc. The D5 provides you with a data set and you need to select the variables for the cluster analysis; you also need to determine the number of clusters that is to be formed. The DS indicated that a solution with three to eight clusters should be workable. A strategy needs to be formulated for each of the found groups. You can use the mean values on the variables in each cluster for formulating the strategy. When formulating a strategy, the use of passive variables could possibly be helpful to gain further insights into the defined clusters. The Data Set: The data set includes data from a direct marketer who sells products only via direct mail. The direct market sends catalogs with product characteristics to customers who then order directly from the catalogs. The marketer has developed customer records to do some analysis. The data set includes n = 1000 customers and the following variables: Age (of customer): old/middle/young); Gender: male/female; OwnHome (whether customer owns home): yeso; Married: single/married; Location: far/close in terms of distance to the nearest brick and mortar store that sells similar products; Salary (yearly salary of customer): in dollars; Children (number of children): 0 to 3 (or more), note that very few clients have more than 3 children, so this variable can be treated as metric or non-metric, this is up to you; History (of previous purchase volume): low/medium/high/NA, where NA means that this customer has not yet purchased; Catalogs: number of catalogs sent, note that this is a metric variable with only four values (6,12,18,24) representing the number of catalogs that the client was sent last year. Because there are only four values the variable can be treated as metric or non-metric, this is up to you; AmountSpent: in dollars. The 4 to 6-page assignment is done individually and consists of: Management summary (1 page or less, not more); A section on the choice of statistical technique(s) and variables (1/2 to 1 page); A section that presents an evaluation of the analysis results, which includes segment profiles and labels (1 to 2 pages); A section formulating the segment specific strategies that the DS can use for each of the segments that were found through cluster analysis (1 to 2 pages); Appendices with SPSS output (not in main text, does not count for page numbers); Quality is more important than quantity
Step by Step Solution
There are 3 Steps involved in it
1 Expert Approved Answer
Step: 1 Unlock
Question Has Been Solved by an Expert!
Get step-by-step solutions from verified subject matter experts
Step: 2 Unlock
Step: 3 Unlock
Students Have Also Explored These Related Finance Questions!