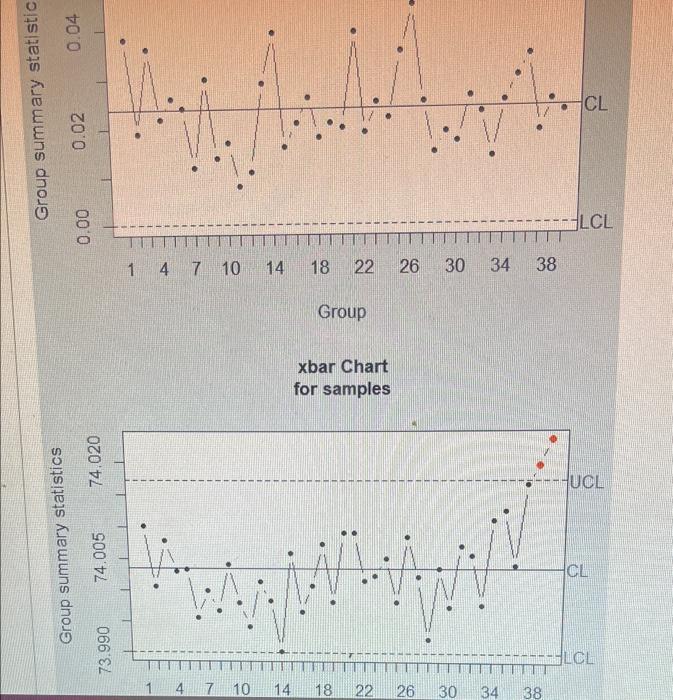
Question: 0.04 CL Group summary statistic 0.02 0.00 LCL 1 4 7 10 14 18 22 26 30 34 38 Group xbar Chart for samples 74.020

0.04 CL Group summary statistic 0.02 0.00 LCL 1 4
0.04 CL Group summary statistic 0.02 0.00 LCL 1 4 7 10 14 18 22 26 30 34 38 Group xbar Chart for samples 74.020 ----UCL Group summary statistics 74.005 CL 73.990 LCL 1 4 7 10 14 18 22 26 30 34 38 When you look at both the x-bar and R charts above, what can you infer? Something has changed that is potentially good for me The process is in control There are serious quality problems My customers could be upset with the process

Step by Step Solution

There are 3 Steps involved in it

1 Expert Approved Answer
Step: 1 Unlock blur-text-image
Question Has Been Solved by an Expert!

Get step-by-step solutions from verified subject matter experts

Step: 2 Unlock
Step: 3 Unlock

Students Have Also Explored These Related General Management Questions!