

Question: Need help on calculating control limits for x-bar and r-chart based on the samples below: Will give thumbs up! X-bar control limit Use the sample
Need help on calculating control limits for x-bar and r-chart based on the samples below:
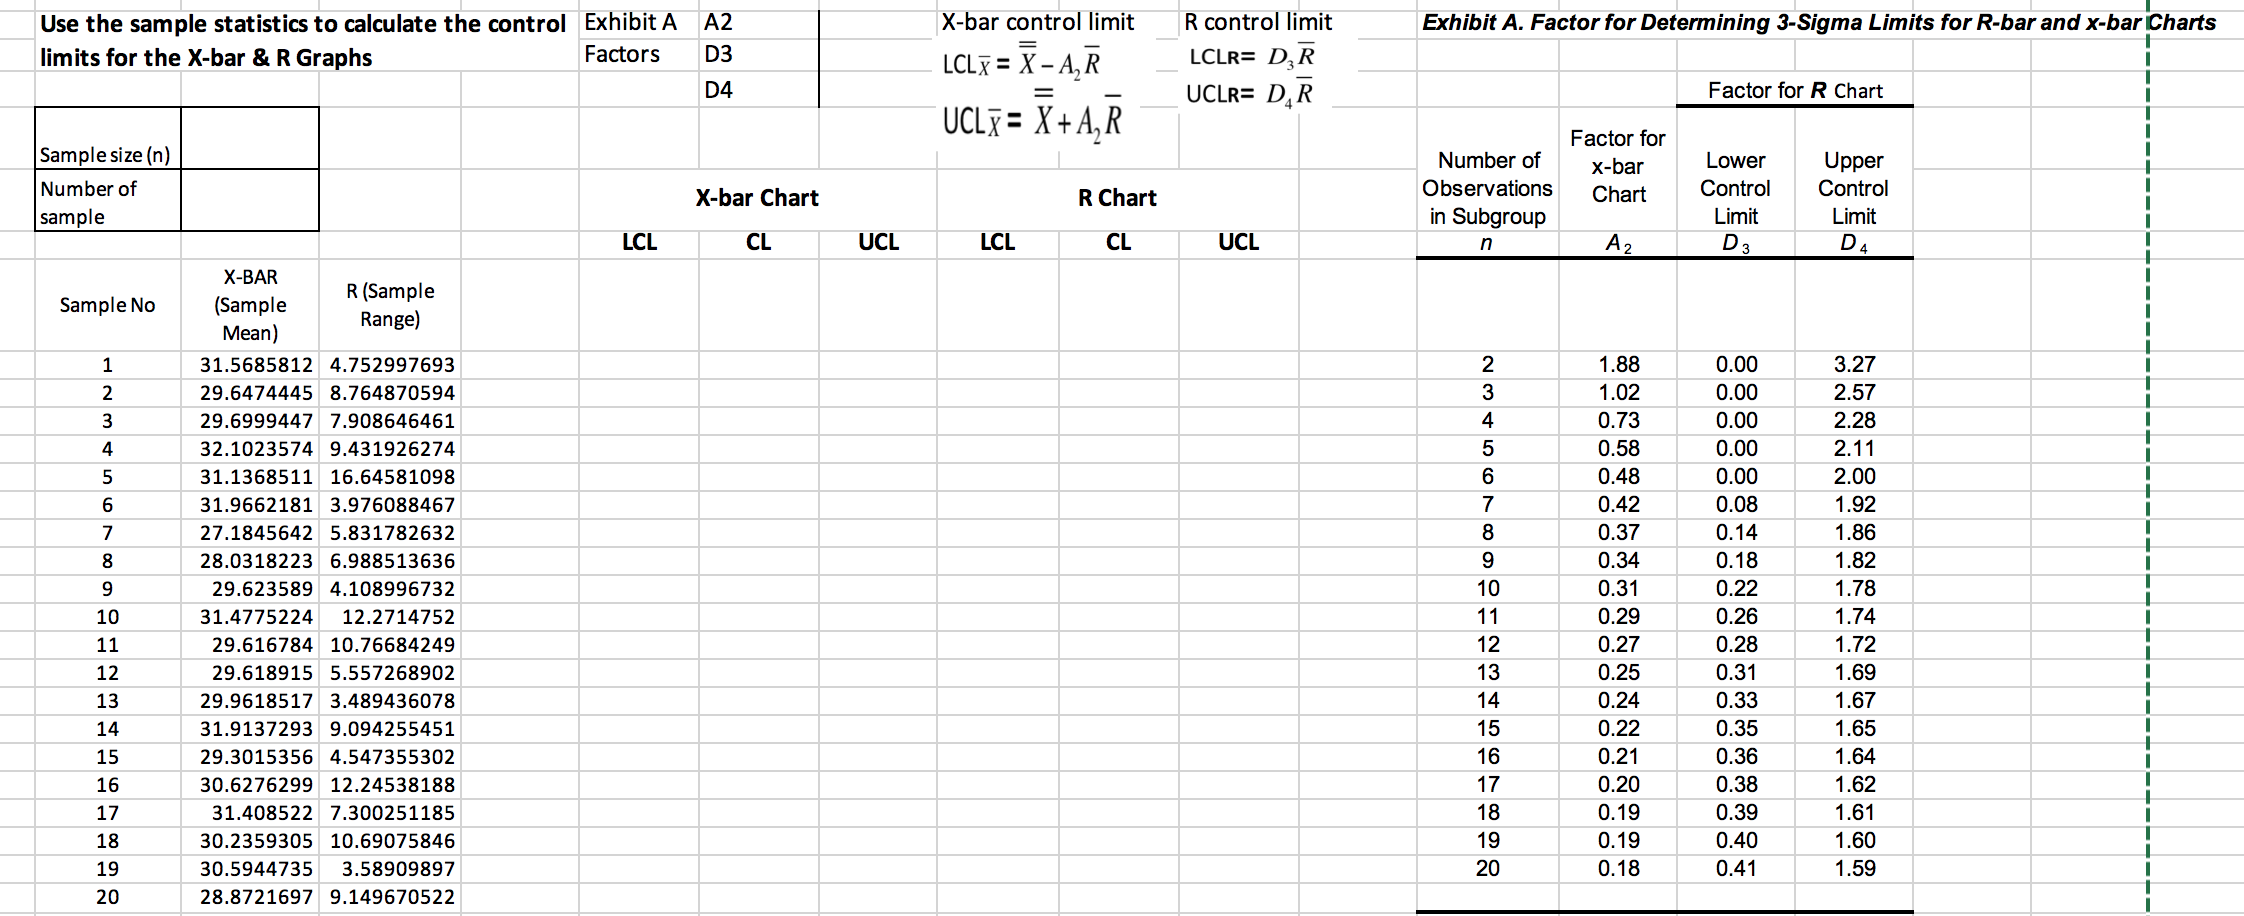
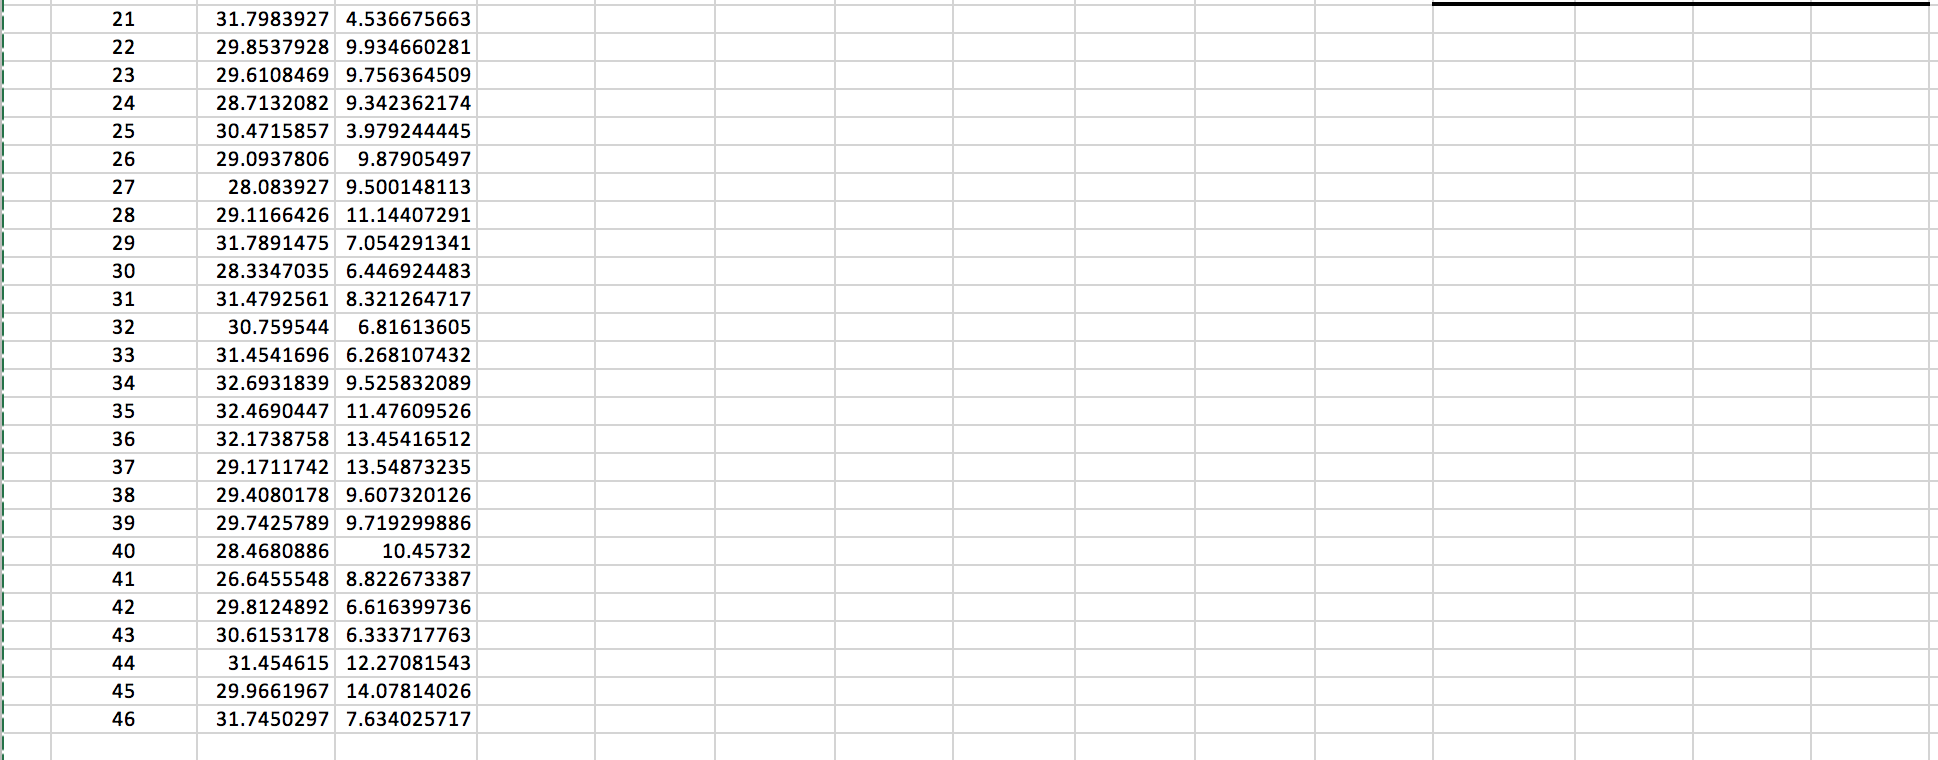
Will give thumbs up!
X-bar control limit Use the sample statistics to calculate the control Exhibit A limits for the X-bar & R Graphs Factors A2 D3 Exhibit A. Factor for Determining 3-Sigma Limits for R-bar and x-bar Charts R control limit LCLR= DER UCLR= D.R LCLX = X A, R UCL7 = X+A, R. D4 = Factor for R Chart 1 I 1 1 Sample size (n) Number of sample Factor for X-bar Chart X-bar Chart Number of Observations in Subgroup n R Chart Lower Control Limit D3 Upper Control Limit D4 I LCL CL UCL LCL CL UCL A2 1 1 I 1 Sample No 1 1 1 2 w NE 3 1 1 1 1 1 1 1 4 5 6 7 8 9 10 11 12 13 14 o X-BAR R (Sample (Sample Range) Mean) 31.5685812 4.752997693 29.6474445 8.764870594 29.6999447 7.908646461 32.1023574 9.431926274 31.1368511 16.64581098 31.9662181 3.976088467 27.1845642 5.831782632 28.0318223 6.988513636 29.623589 4.108996732 31.4775224 12.2714752 29.616784 10.76684249 29.618915 5.557268902 29.9618517 3.489436078 31.9137293 9.094255451 29.3015356 4.547355302 30.6276299 12.24538188 31.408522 7.300251185 30.2359305 10.69075846 30.5944735 3.58909897 28.8721697 9.149670522 10 23456789212315 1 3 1.88 1.02 0.73 0.58 0.48 0.42 0.37 0.34 0.31 0.29 0.27 0.25 0.24 0.22 0.21 0.20 0.19 0.19 0.18 0.00 0.00 0.00 0.00 0.00 0.08 0.14 0.18 0.22 0.26 0.28 0.31 0.33 0.35 0.36 0.38 0.39 0.40 0.41 3.27 2.57 2.28 2.11 2.00 1.92 1.86 1.82 1.78 1.74 1.72 1.69 1.67 1.65 1.64 1.62 1.61 1.60 1.59 1 1 1 1 1 1 1 15 16 16 17 18 19 20 17 18 19 20 1 1 | | | 21 22 23 24 25 26 | 27 28 | | 29 30 31 I || aa84%98a8888%99H&B=9 32 33 34 31.7983927 4.536675663 29.8537928 9.934660281 29.6108469 9.756364509 28.7132082 9.342362174 30.4715857 3.979244445 29.0937806 9.87905497 28.083927 9.500148113 29.1166426 11.14407291 31.7891475 7.054291341 28.3347035 6.446924483 31.4792561 8.321264717 30.759544 6.81613605 31.4541696 6.268107432 32.6931839 9.525832089 32.4690447 11.47609526 32.1738758 13.45416512 29.1711742 13.54873235 29.4080178 9.607320126 29.7425789 9.719299886 28.4680886 10.45732 26.6455548 8.822673387 29.8124892 6.616399736 30.6153178 6.333717763 31.454615 12.27081543 29.9661967 14.07814026 31.7450297 7.634025717 | 35 36 37 | 38 39 40 | || 41 42 43 | 44 45 46 X-bar control limit Use the sample statistics to calculate the control Exhibit A limits for the X-bar & R Graphs Factors A2 D3 Exhibit A. Factor for Determining 3-Sigma Limits for R-bar and x-bar Charts R control limit LCLR= DER UCLR= D.R LCLX = X A, R UCL7 = X+A, R. D4 = Factor for R Chart 1 I 1 1 Sample size (n) Number of sample Factor for X-bar Chart X-bar Chart Number of Observations in Subgroup n R Chart Lower Control Limit D3 Upper Control Limit D4 I LCL CL UCL LCL CL UCL A2 1 1 I 1 Sample No 1 1 1 2 w NE 3 1 1 1 1 1 1 1 4 5 6 7 8 9 10 11 12 13 14 o X-BAR R (Sample (Sample Range) Mean) 31.5685812 4.752997693 29.6474445 8.764870594 29.6999447 7.908646461 32.1023574 9.431926274 31.1368511 16.64581098 31.9662181 3.976088467 27.1845642 5.831782632 28.0318223 6.988513636 29.623589 4.108996732 31.4775224 12.2714752 29.616784 10.76684249 29.618915 5.557268902 29.9618517 3.489436078 31.9137293 9.094255451 29.3015356 4.547355302 30.6276299 12.24538188 31.408522 7.300251185 30.2359305 10.69075846 30.5944735 3.58909897 28.8721697 9.149670522 10 23456789212315 1 3 1.88 1.02 0.73 0.58 0.48 0.42 0.37 0.34 0.31 0.29 0.27 0.25 0.24 0.22 0.21 0.20 0.19 0.19 0.18 0.00 0.00 0.00 0.00 0.00 0.08 0.14 0.18 0.22 0.26 0.28 0.31 0.33 0.35 0.36 0.38 0.39 0.40 0.41 3.27 2.57 2.28 2.11 2.00 1.92 1.86 1.82 1.78 1.74 1.72 1.69 1.67 1.65 1.64 1.62 1.61 1.60 1.59 1 1 1 1 1 1 1 15 16 16 17 18 19 20 17 18 19 20 1 1 | | | 21 22 23 24 25 26 | 27 28 | | 29 30 31 I || aa84%98a8888%99H&B=9 32 33 34 31.7983927 4.536675663 29.8537928 9.934660281 29.6108469 9.756364509 28.7132082 9.342362174 30.4715857 3.979244445 29.0937806 9.87905497 28.083927 9.500148113 29.1166426 11.14407291 31.7891475 7.054291341 28.3347035 6.446924483 31.4792561 8.321264717 30.759544 6.81613605 31.4541696 6.268107432 32.6931839 9.525832089 32.4690447 11.47609526 32.1738758 13.45416512 29.1711742 13.54873235 29.4080178 9.607320126 29.7425789 9.719299886 28.4680886 10.45732 26.6455548 8.822673387 29.8124892 6.616399736 30.6153178 6.333717763 31.454615 12.27081543 29.9661967 14.07814026 31.7450297 7.634025717 | 35 36 37 | 38 39 40 | || 41 42 43 | 44 45 46Step by Step Solution
There are 3 Steps involved in it
1 Expert Approved Answer
Step: 1 Unlock

Question Has Been Solved by an Expert!
Get step-by-step solutions from verified subject matter experts
Step: 2 Unlock
Step: 3 Unlock