

Question: 0:12:1 1 elapsed X Question 1 (1 point) ) Listen X Number of MIRSA bacteraemias by total positive blood cultures examined in all acute NHS
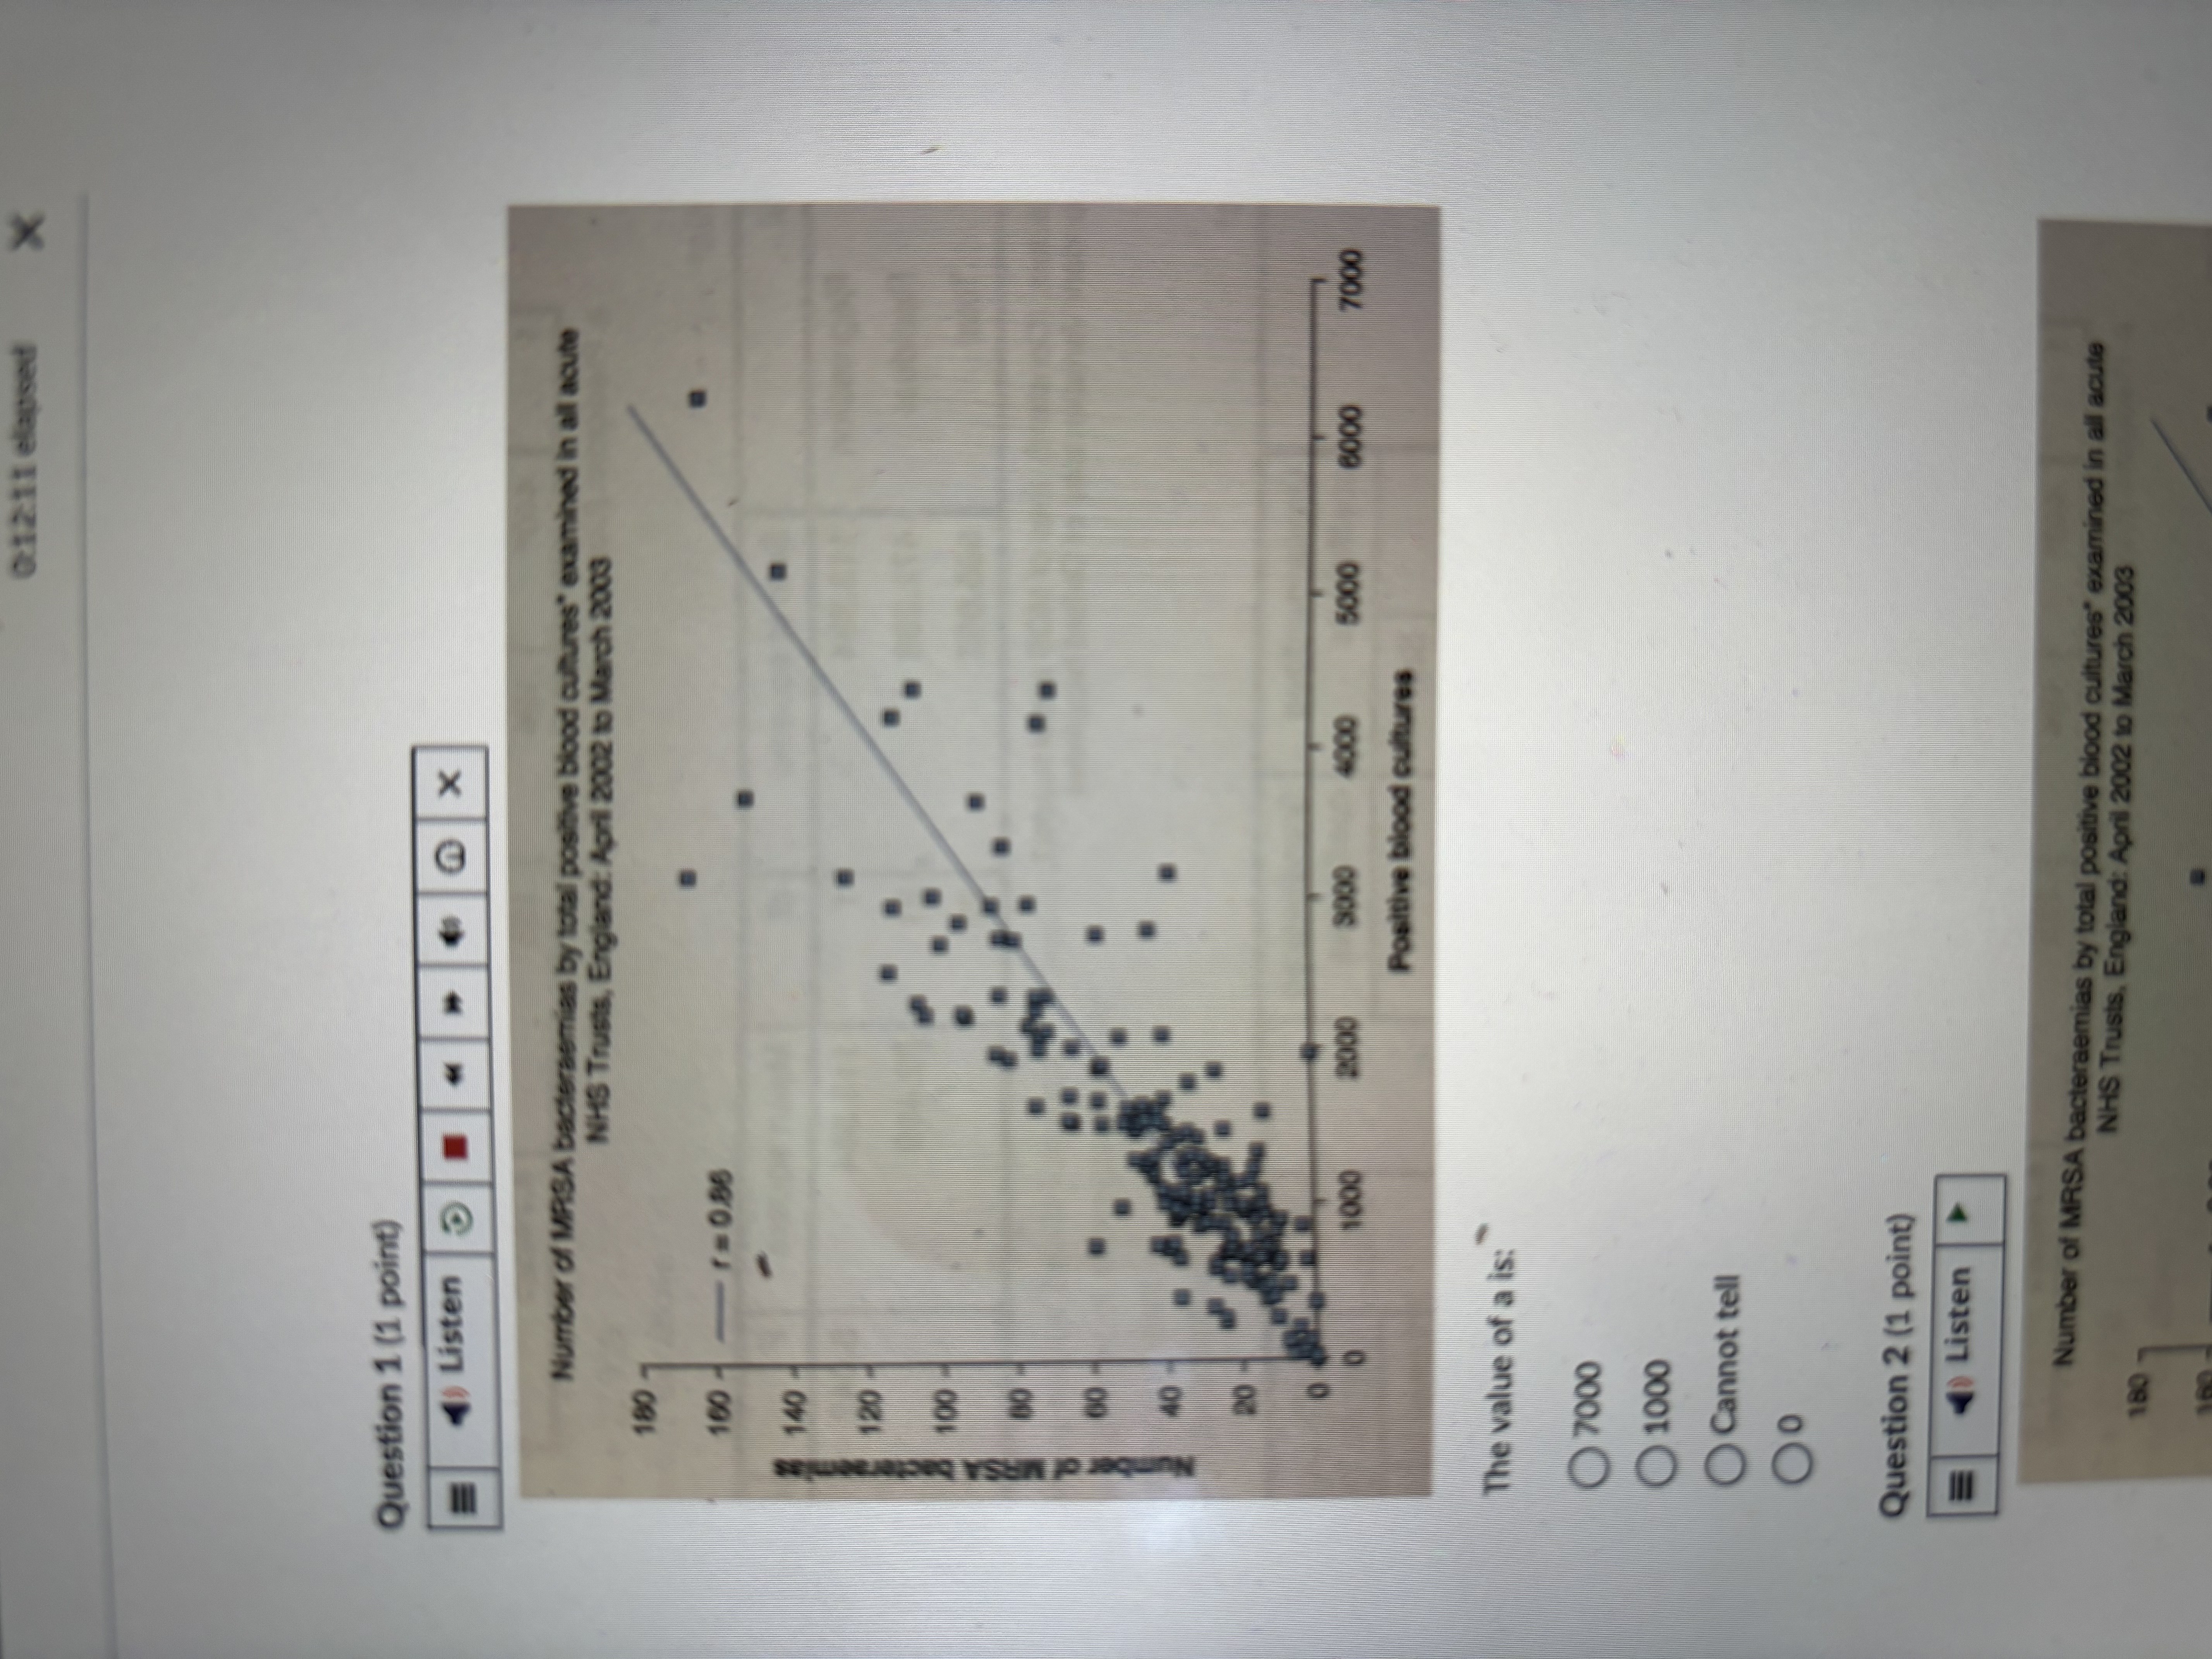
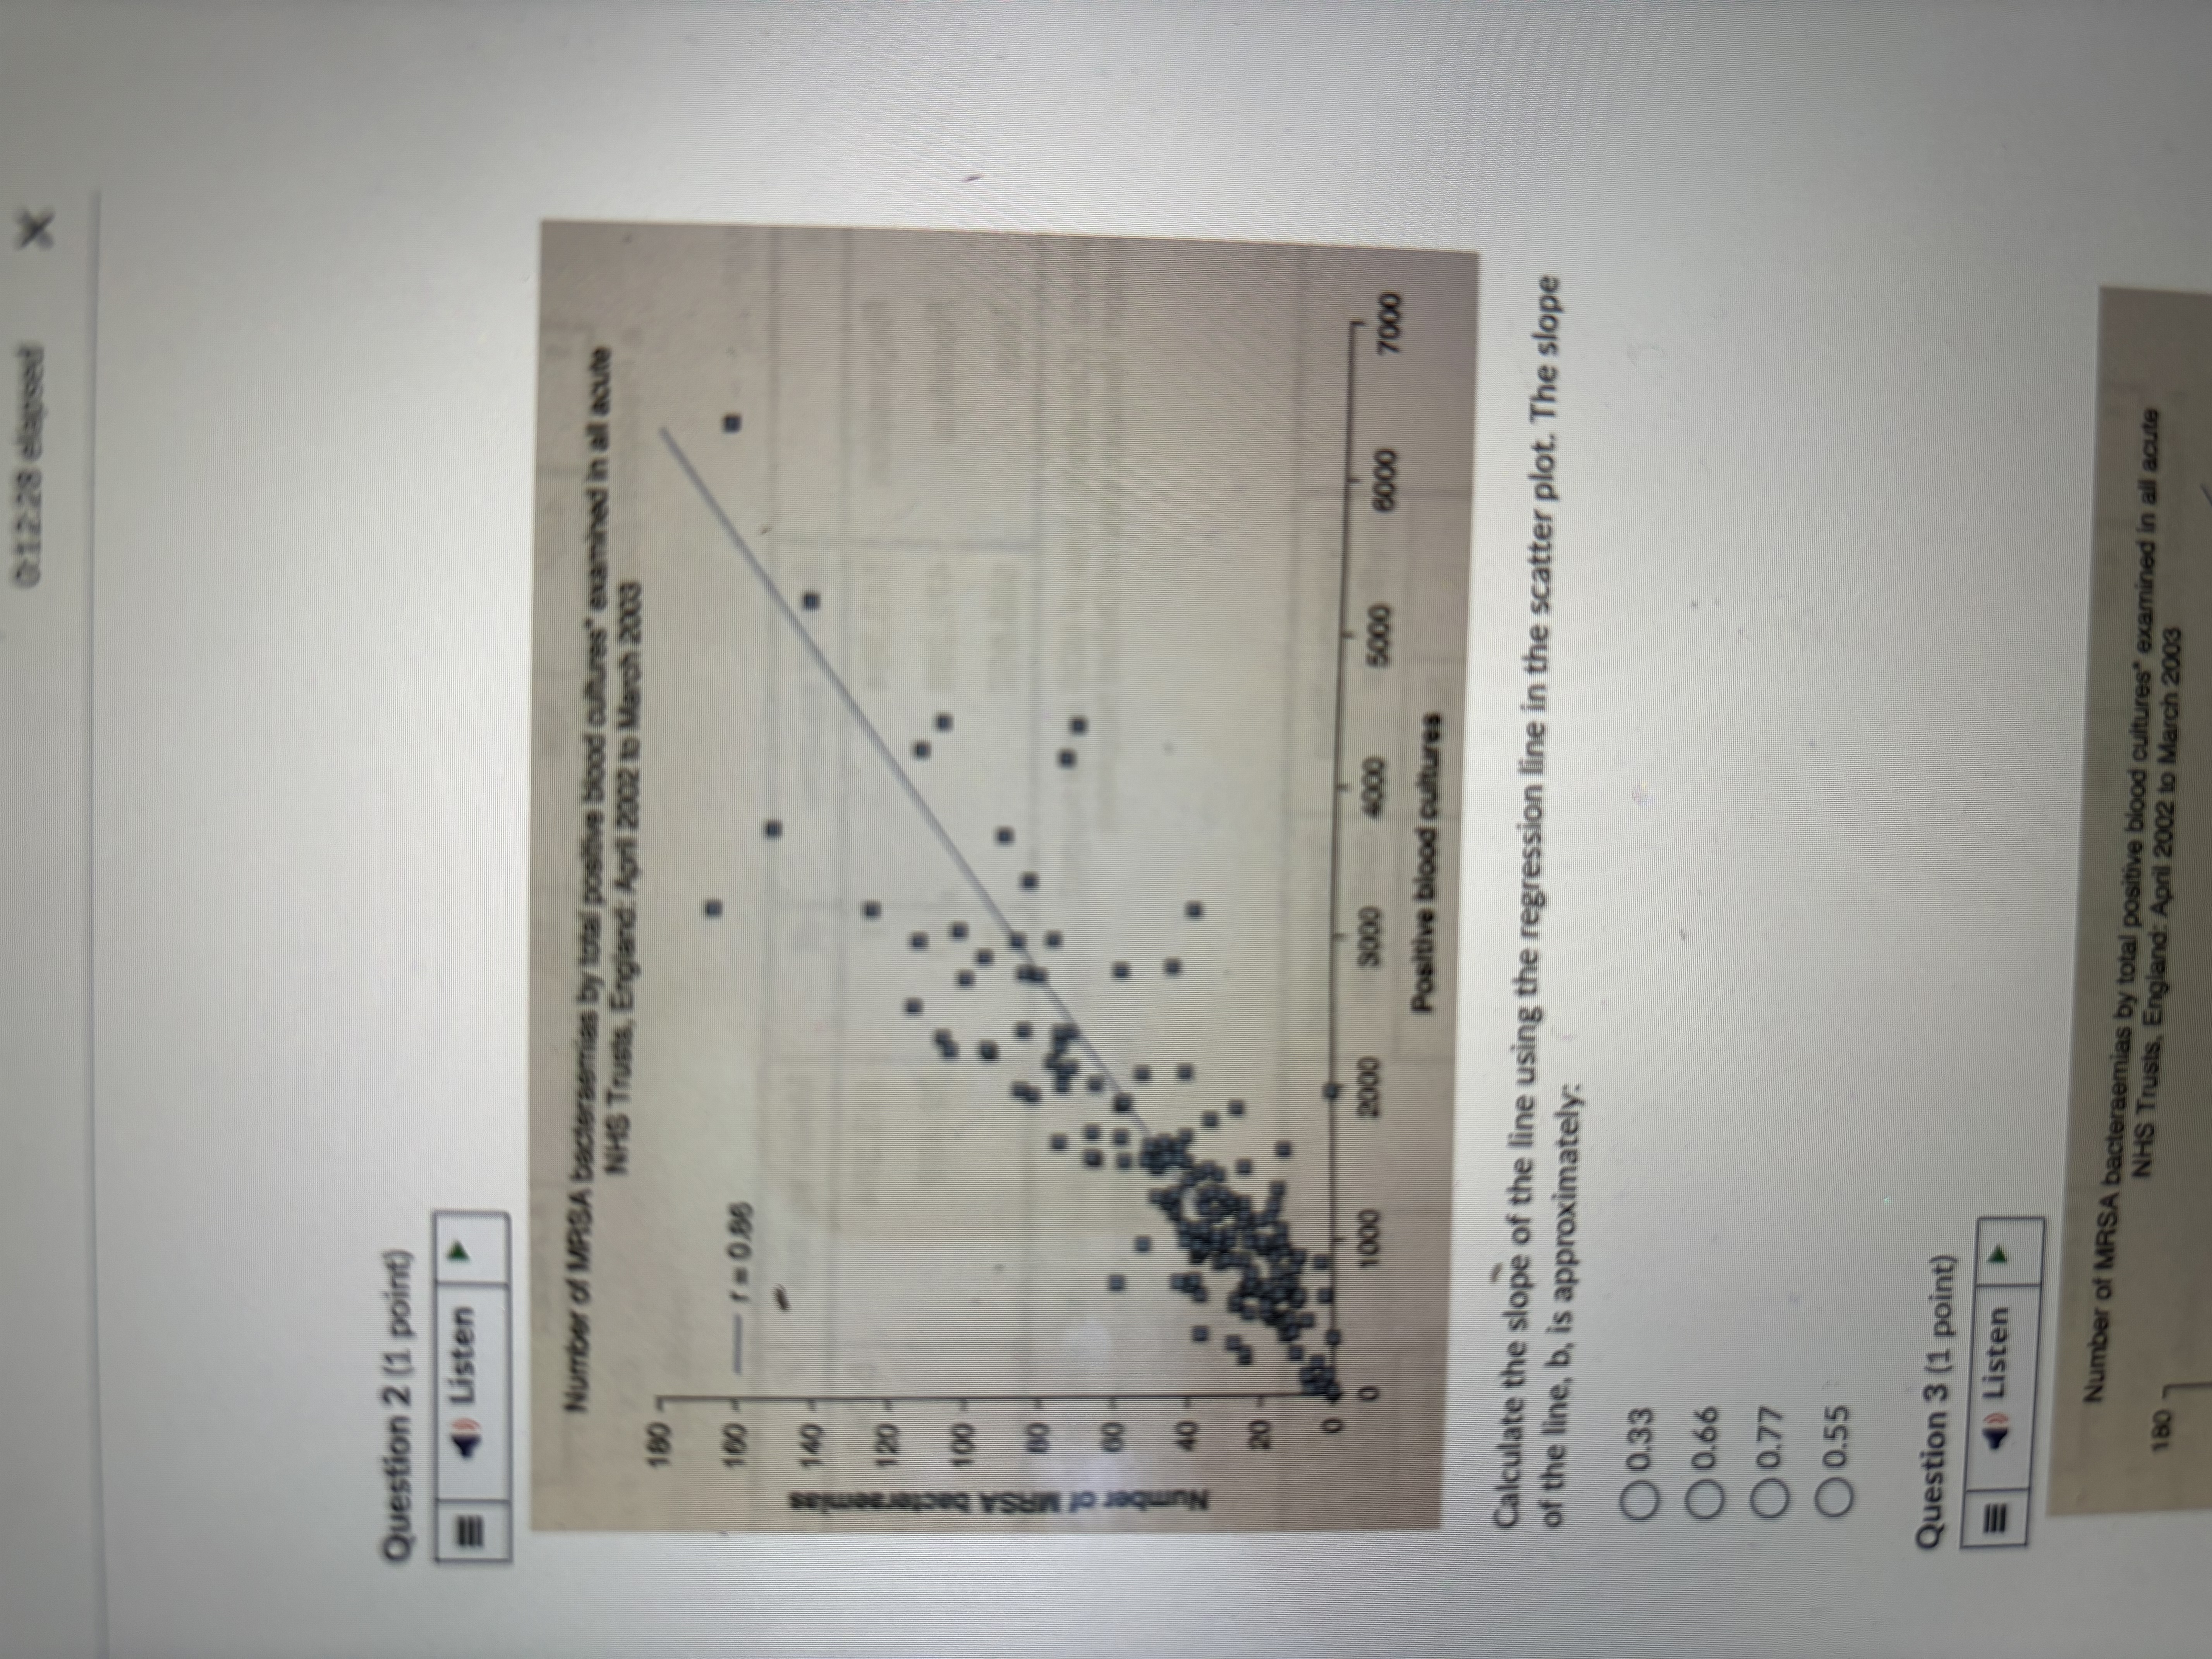
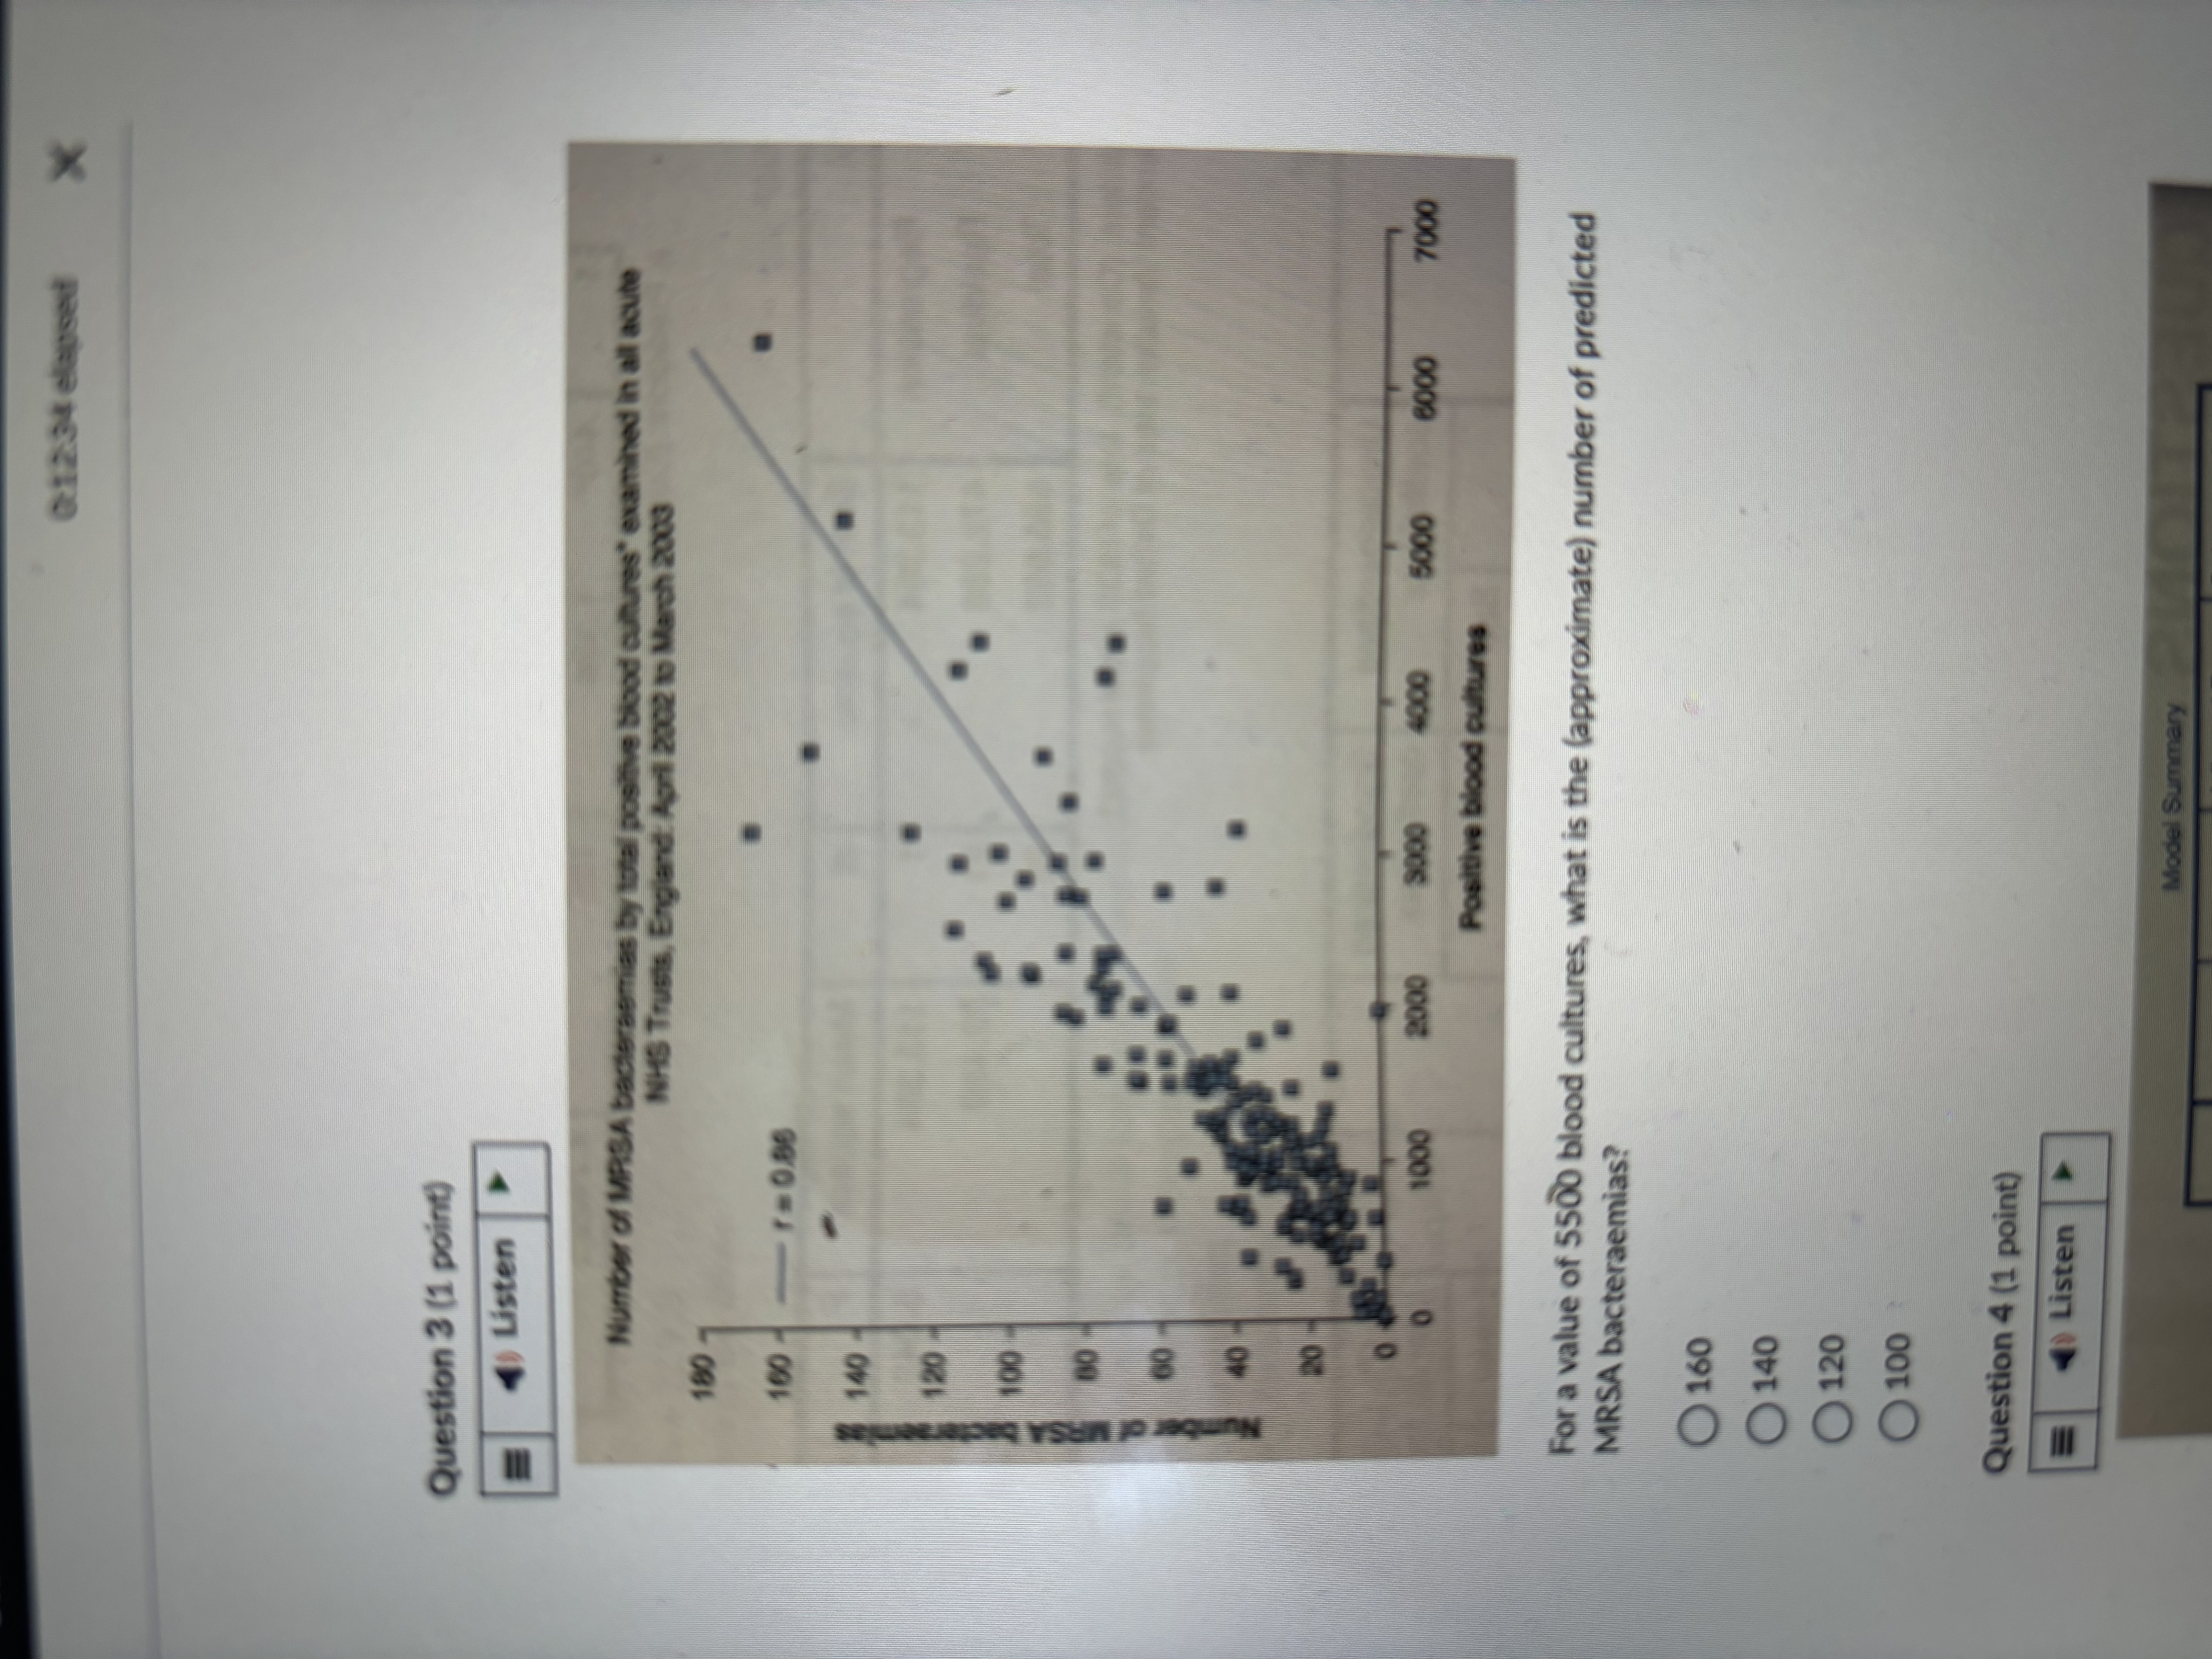
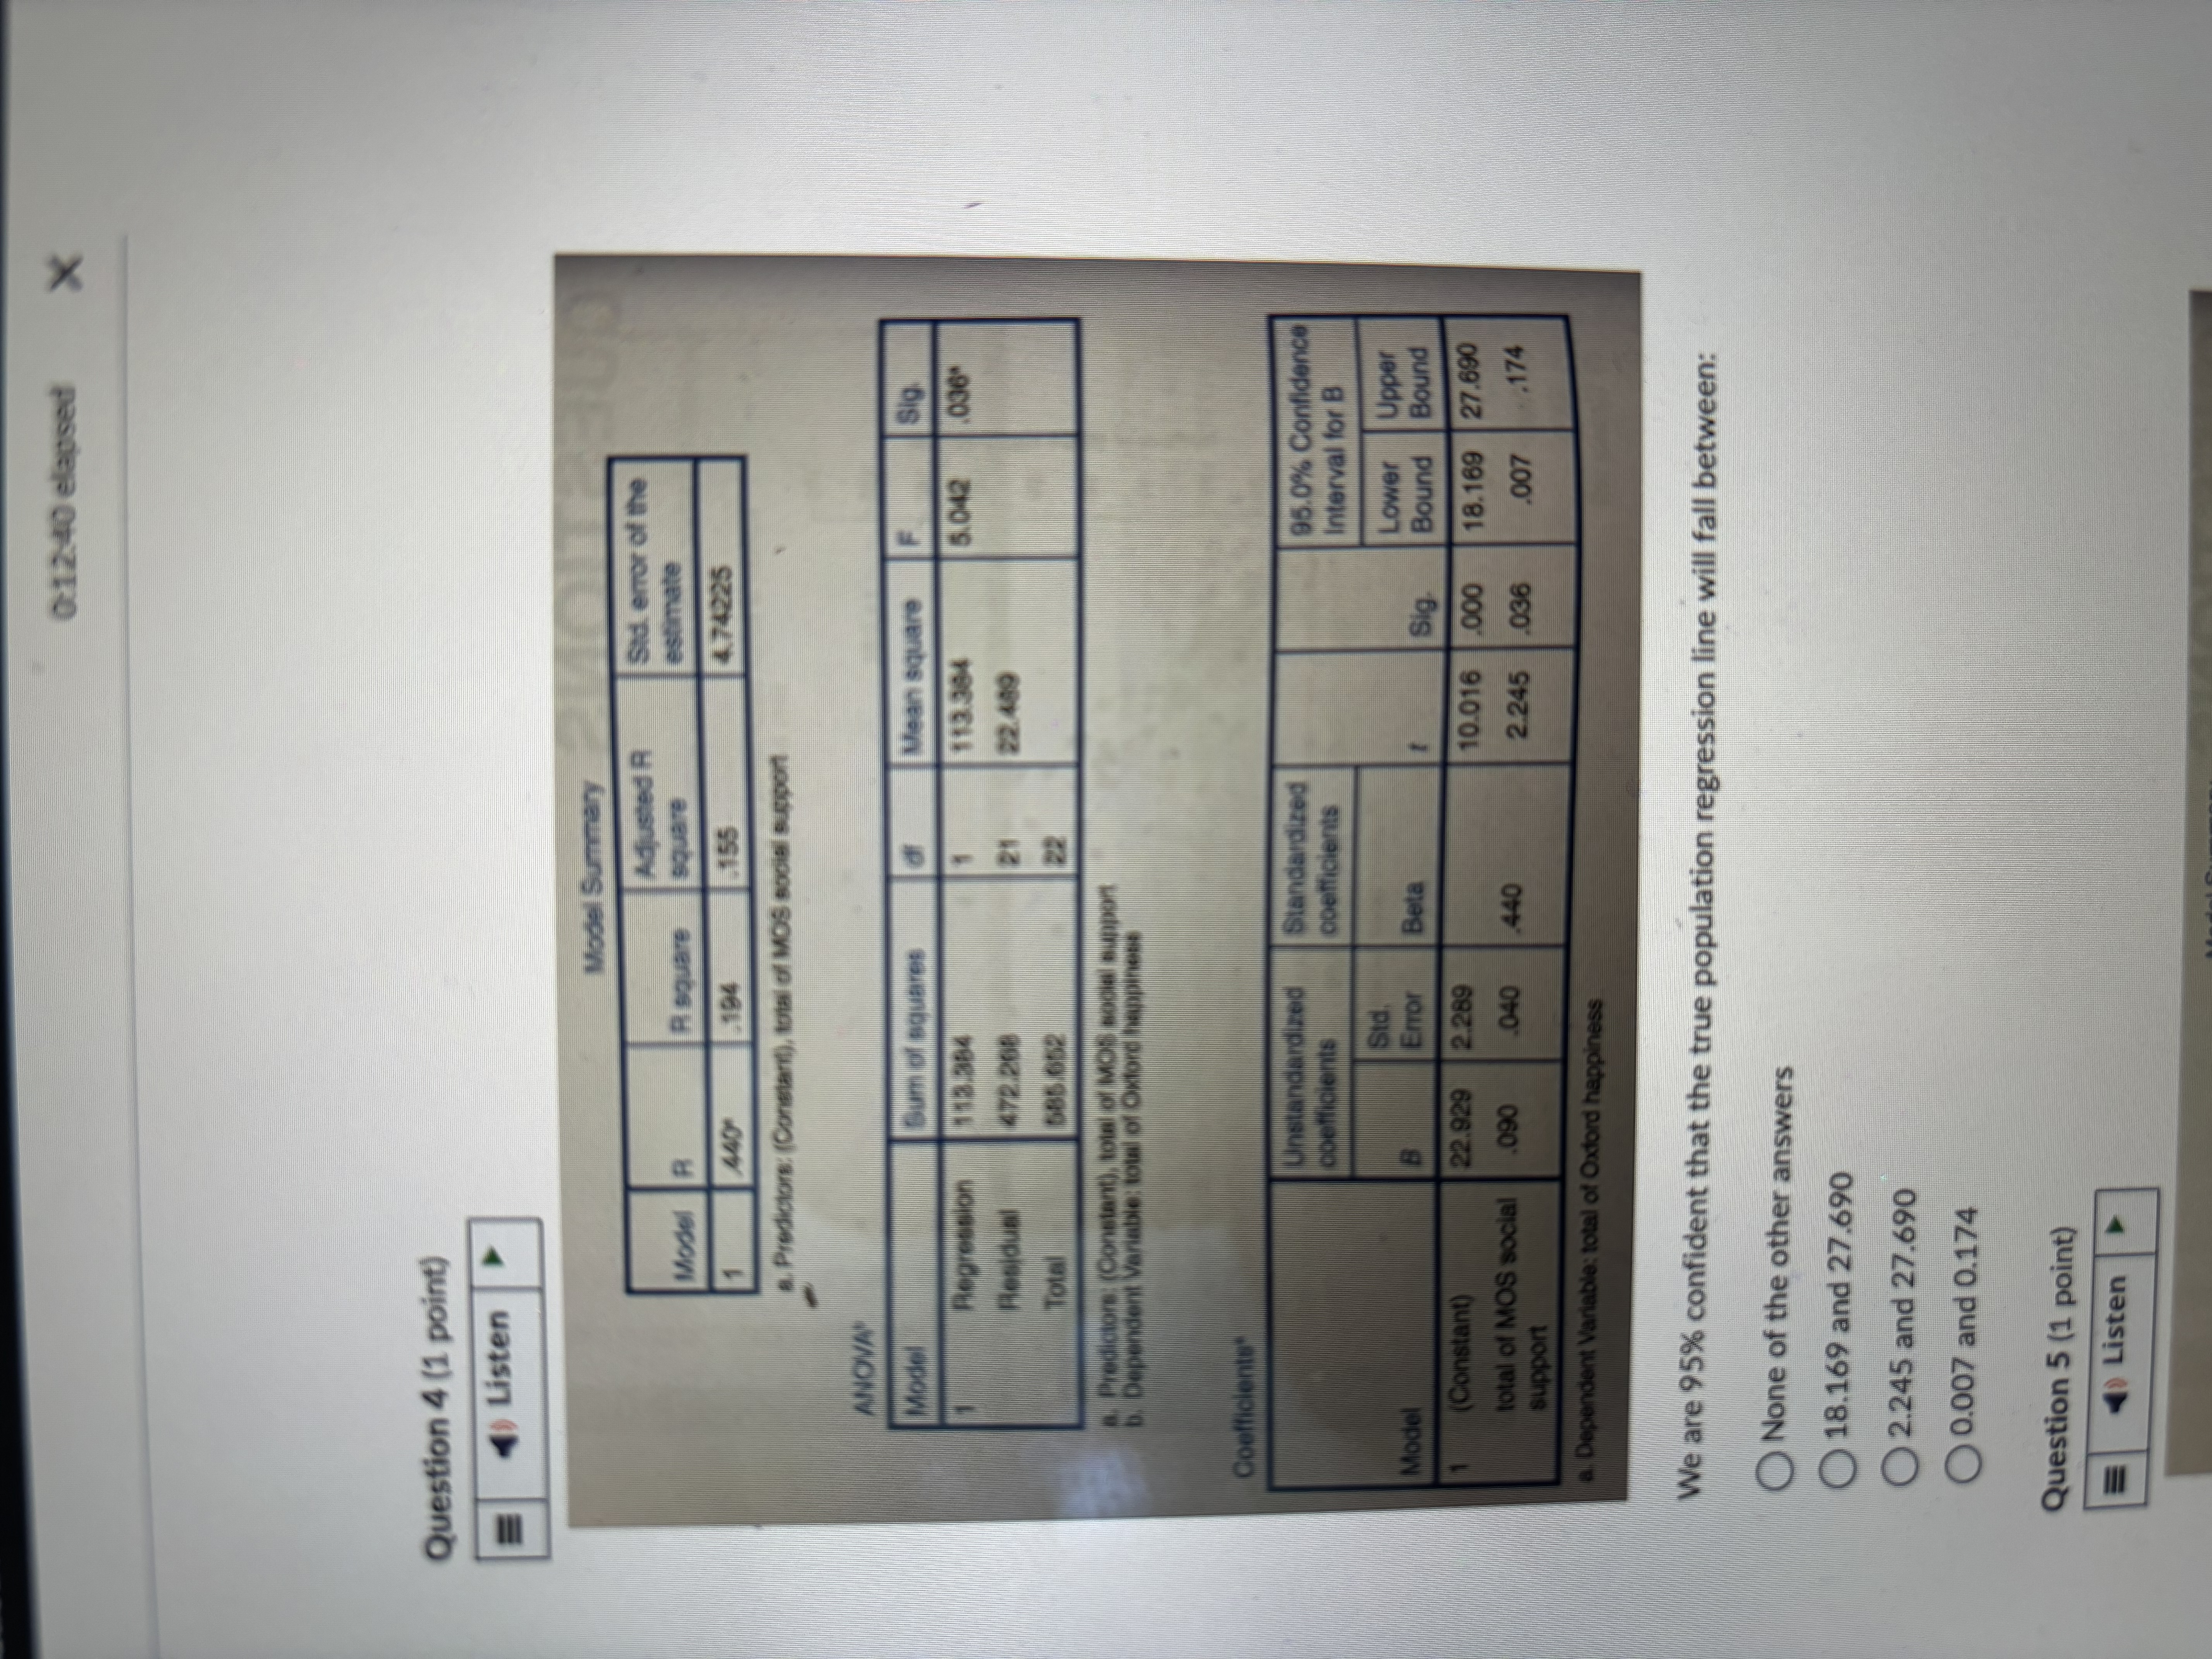
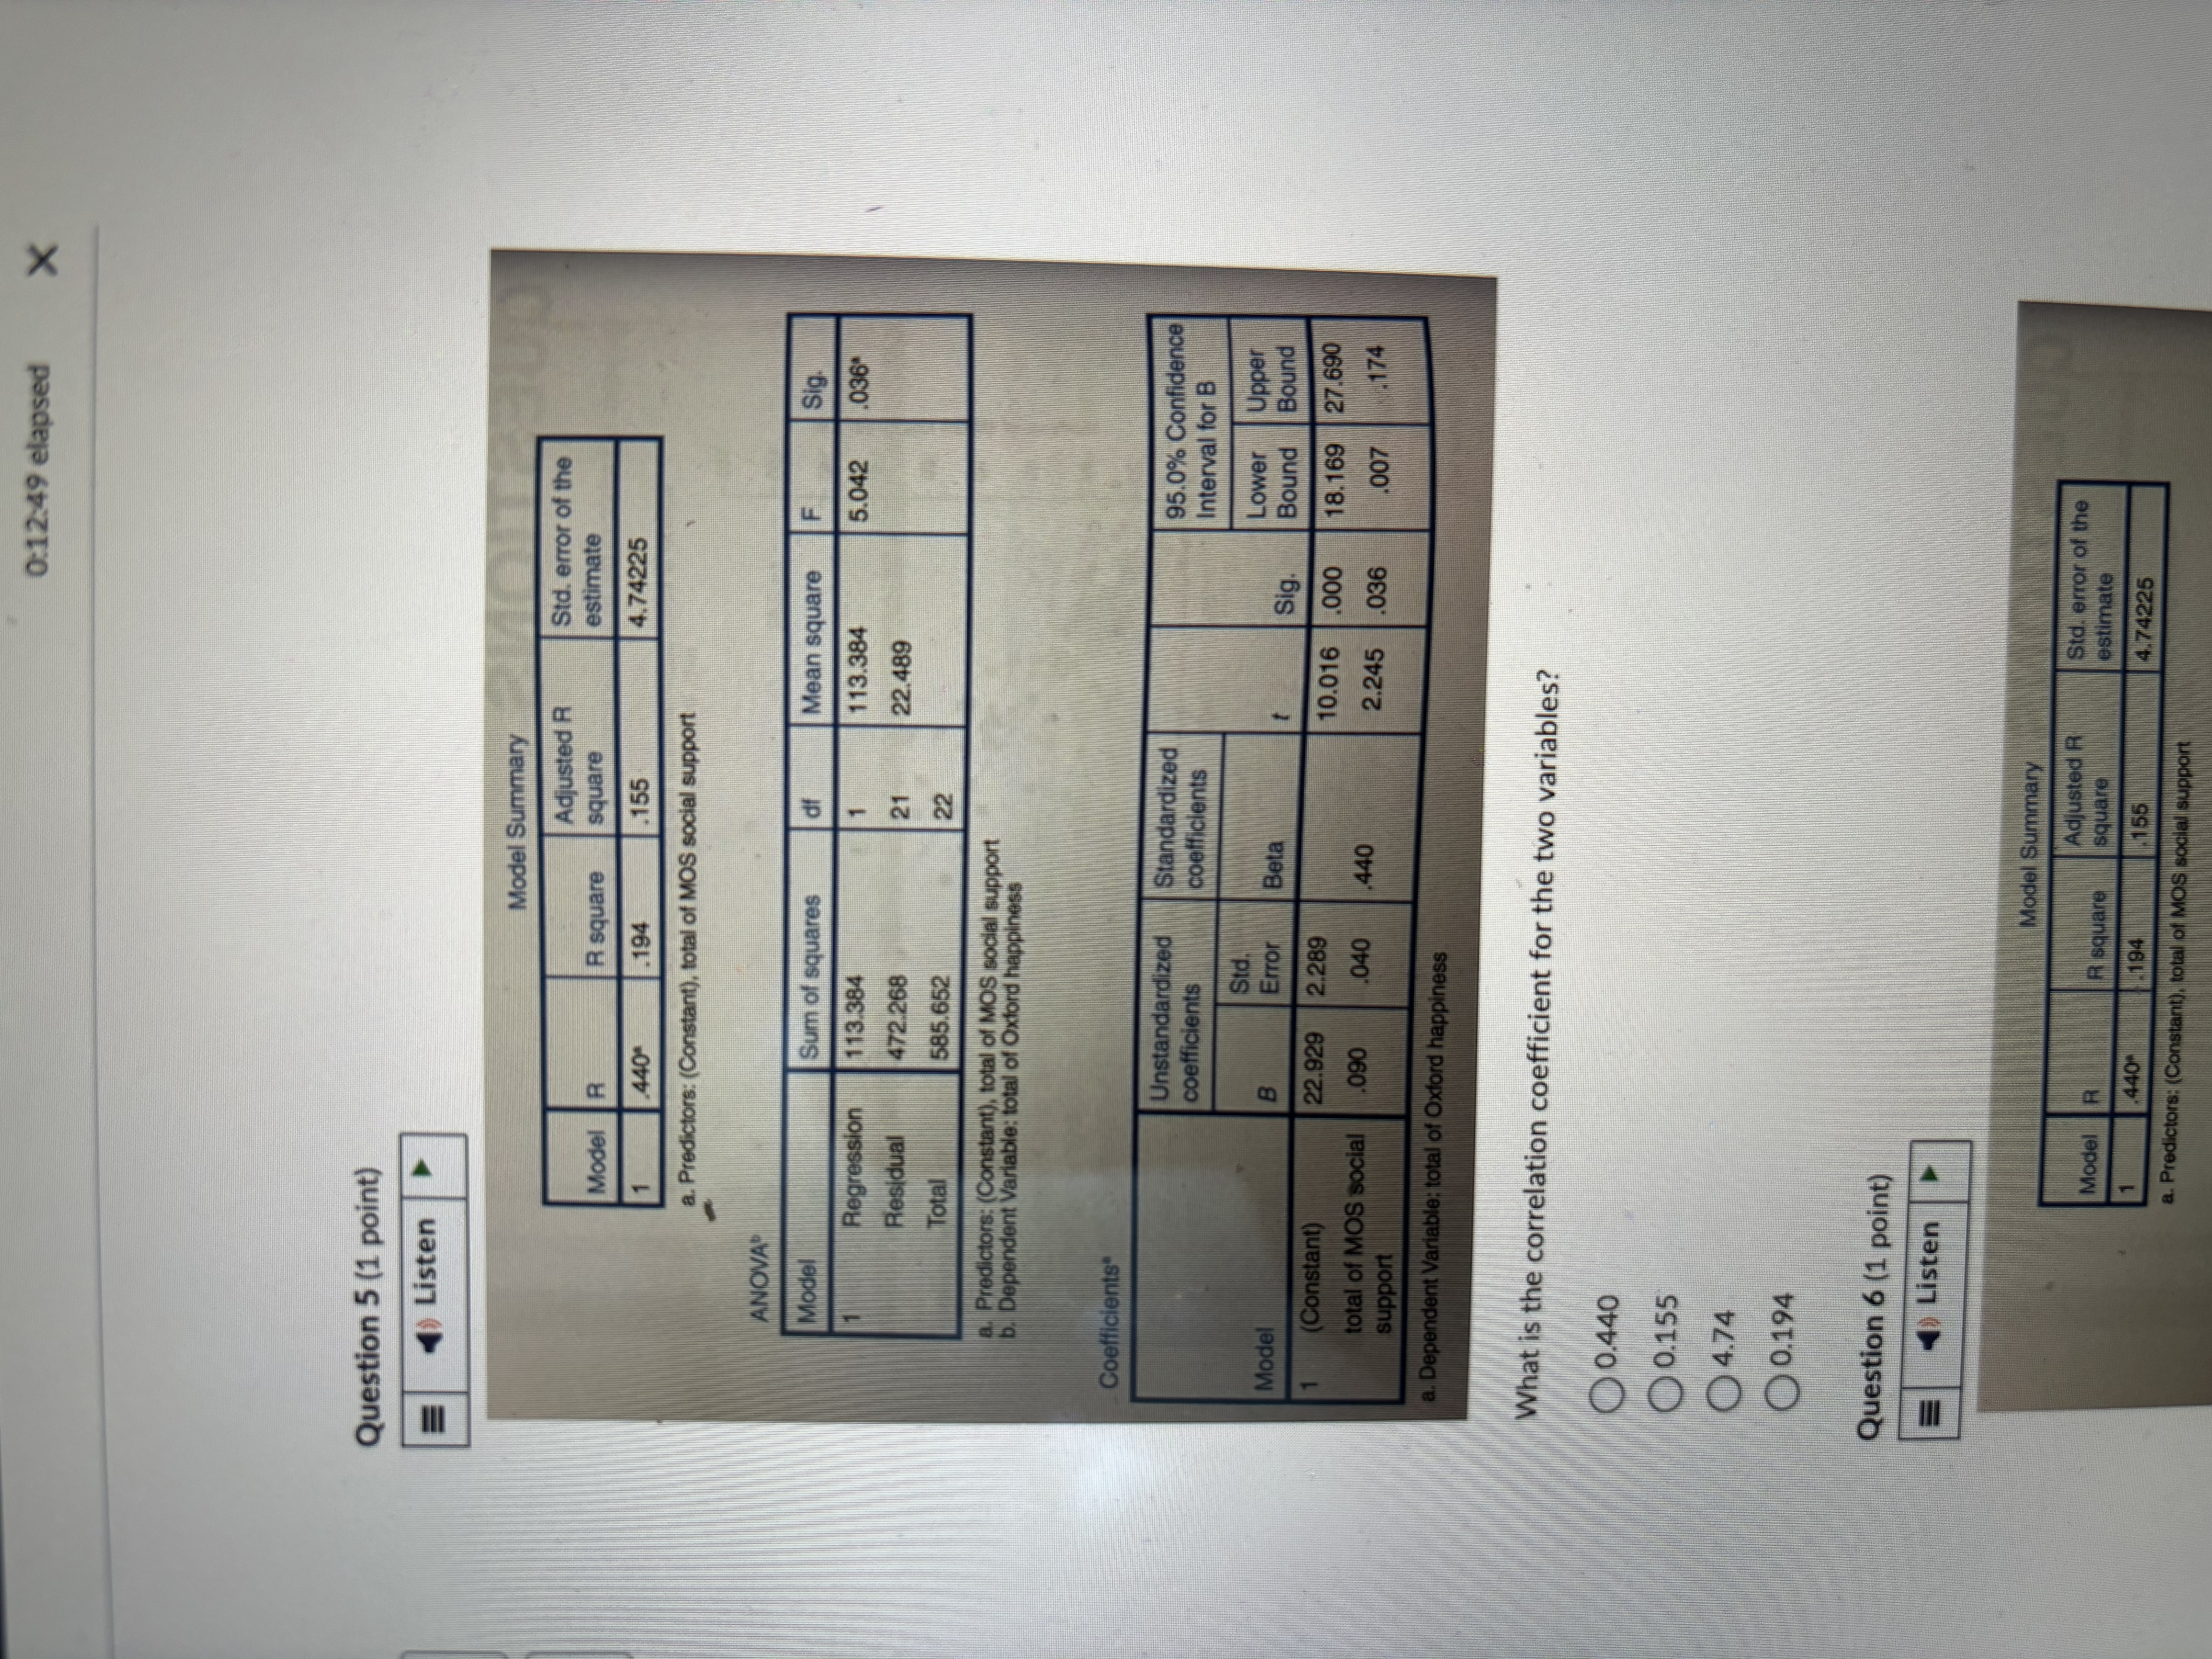
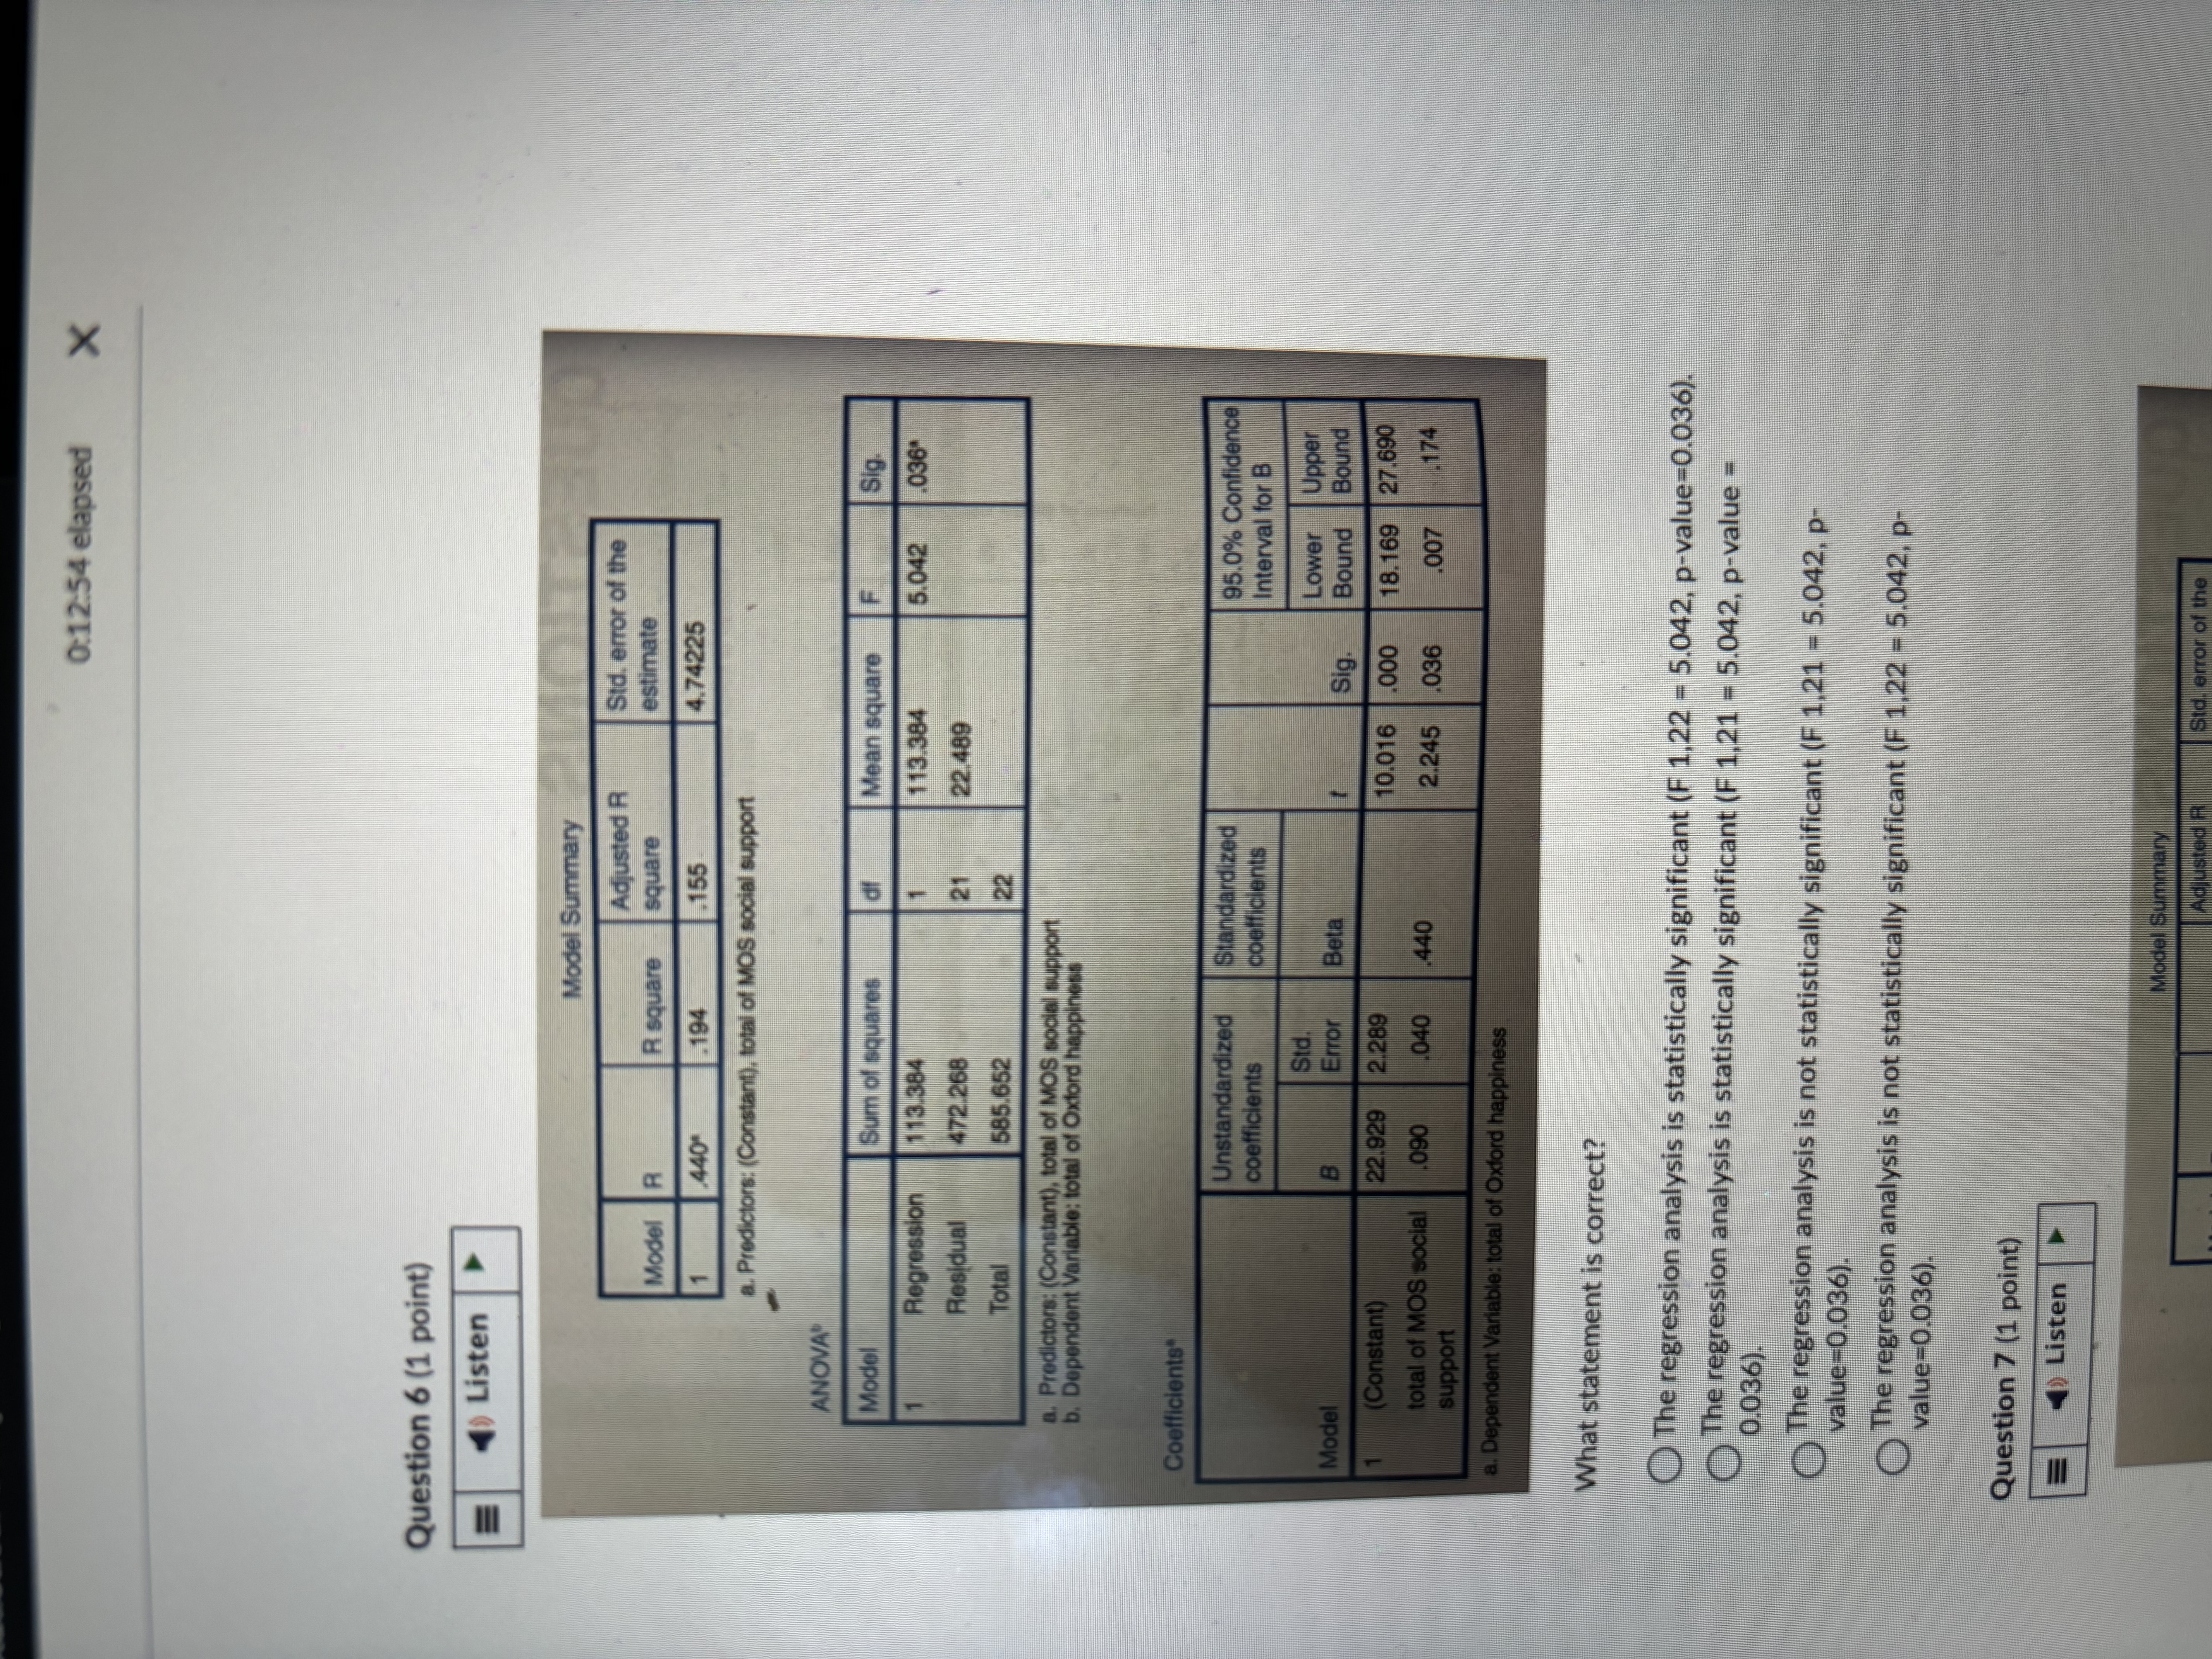
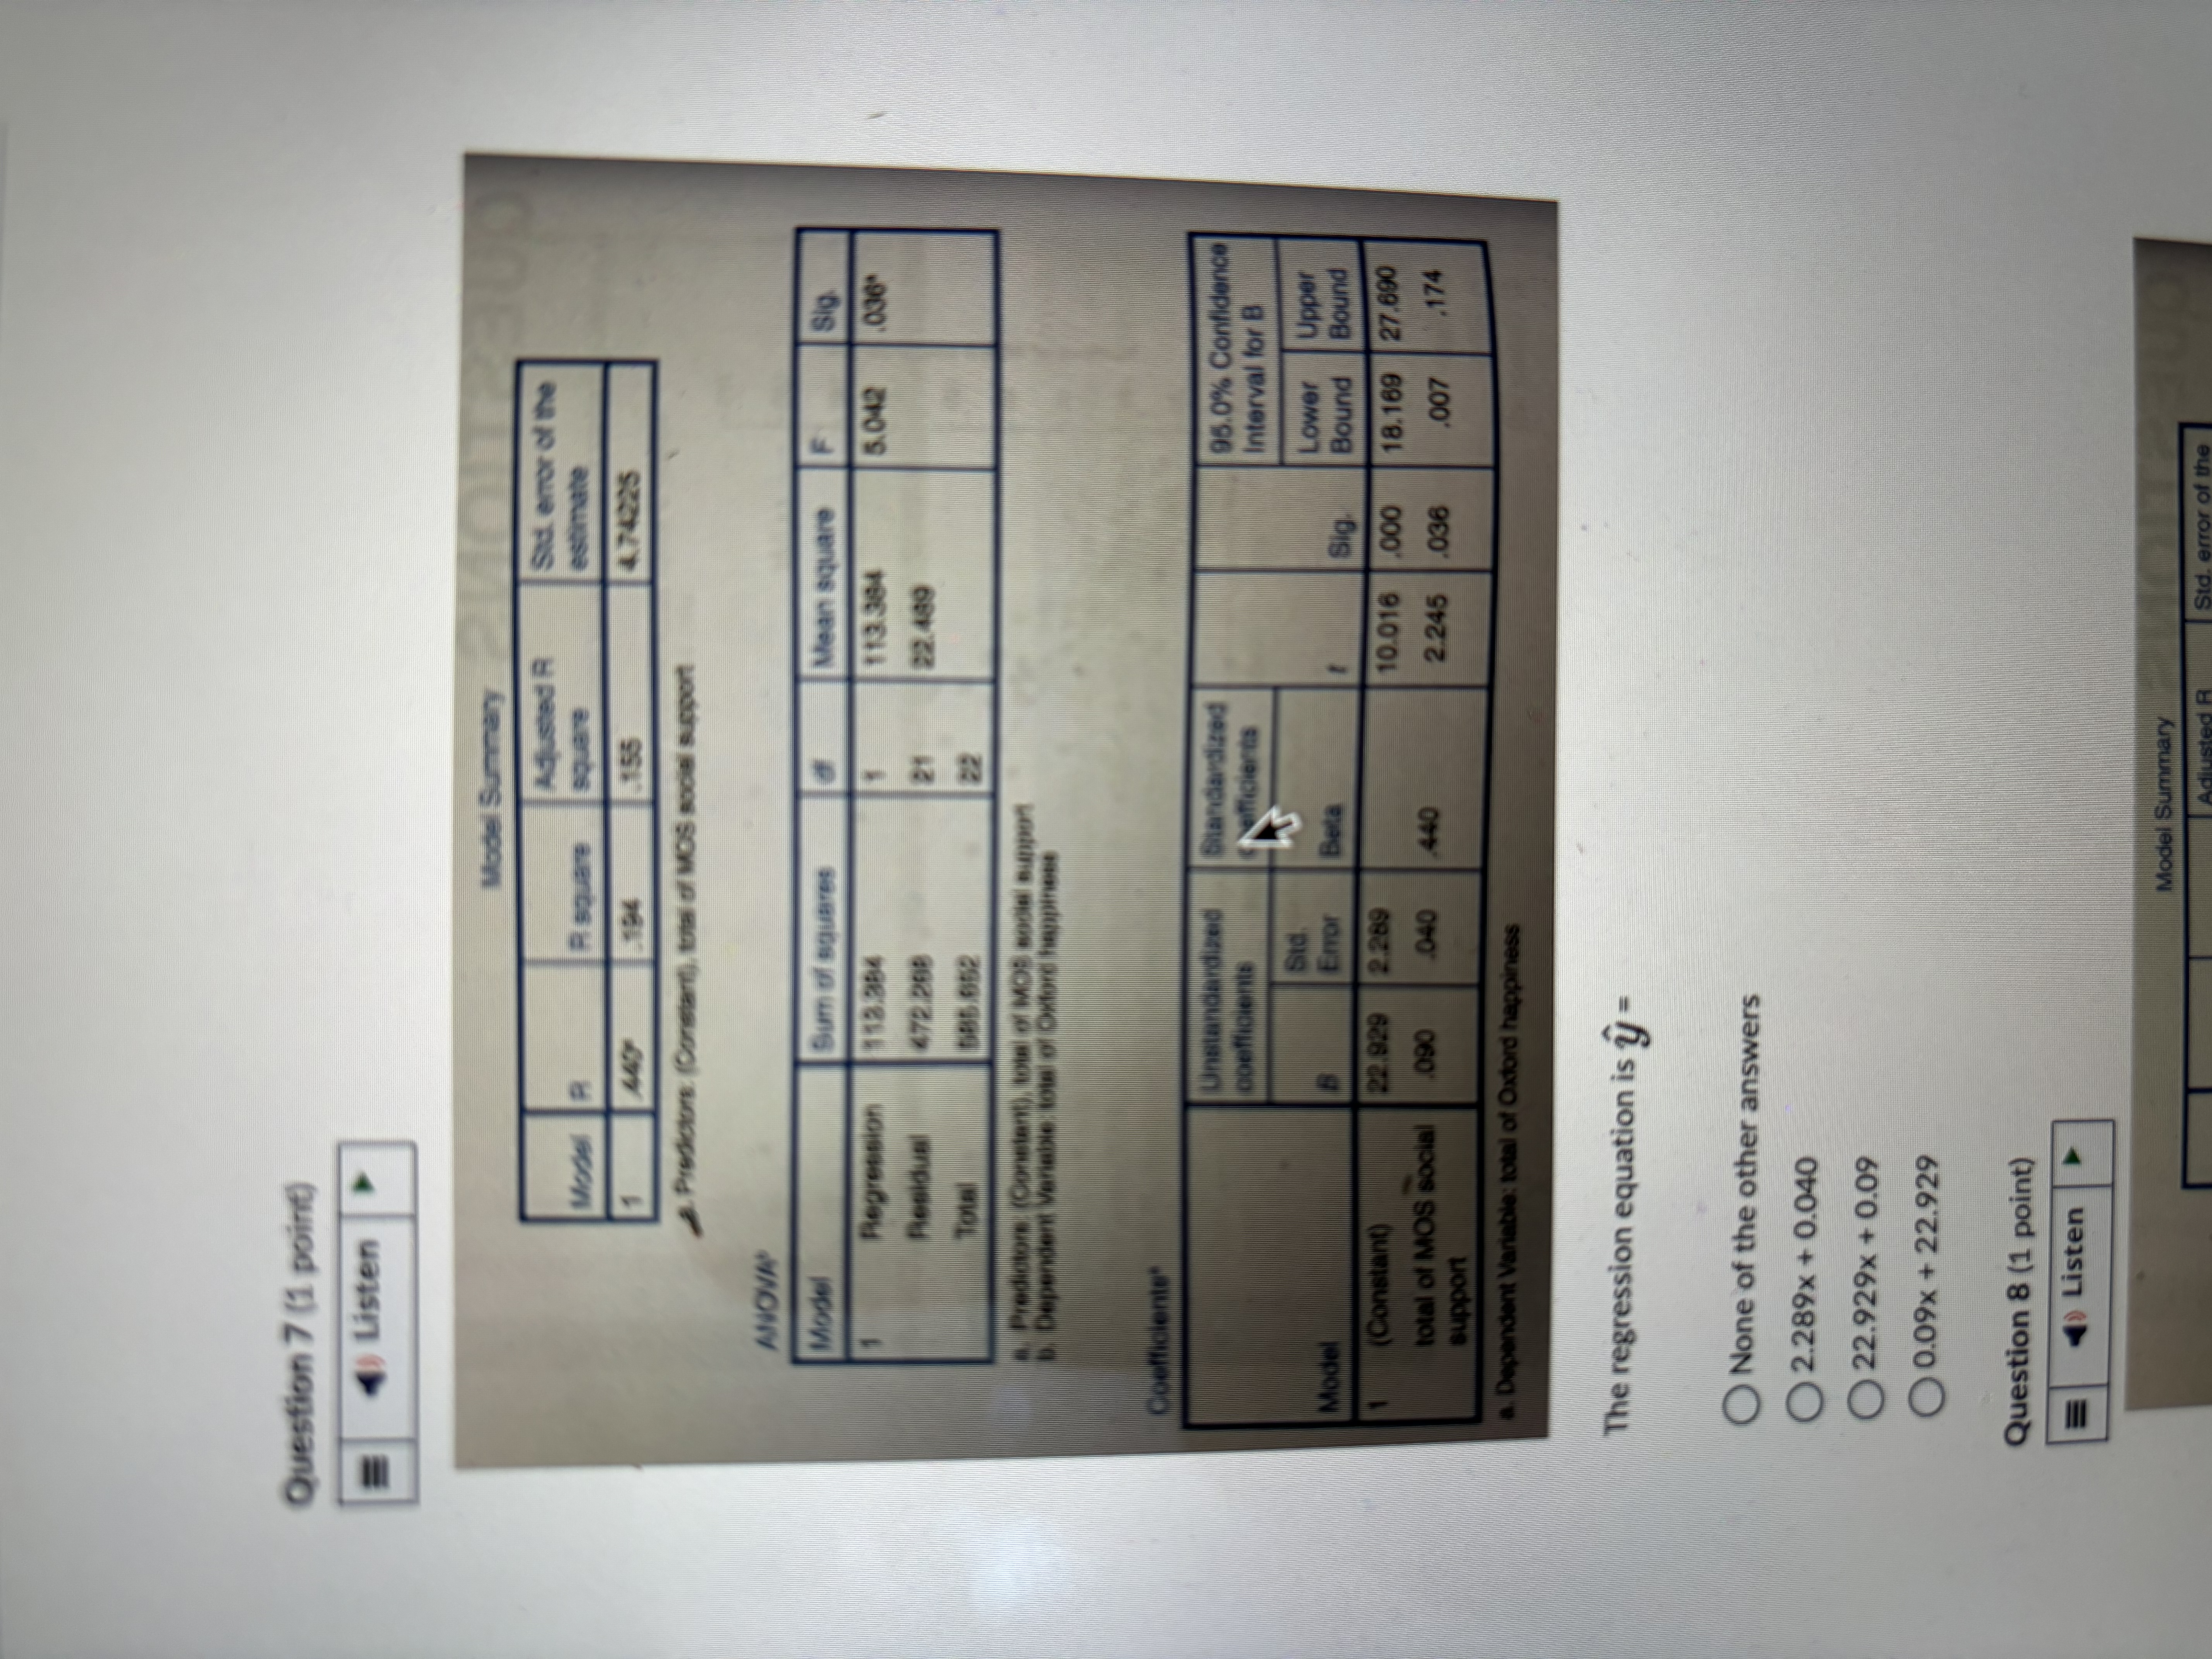
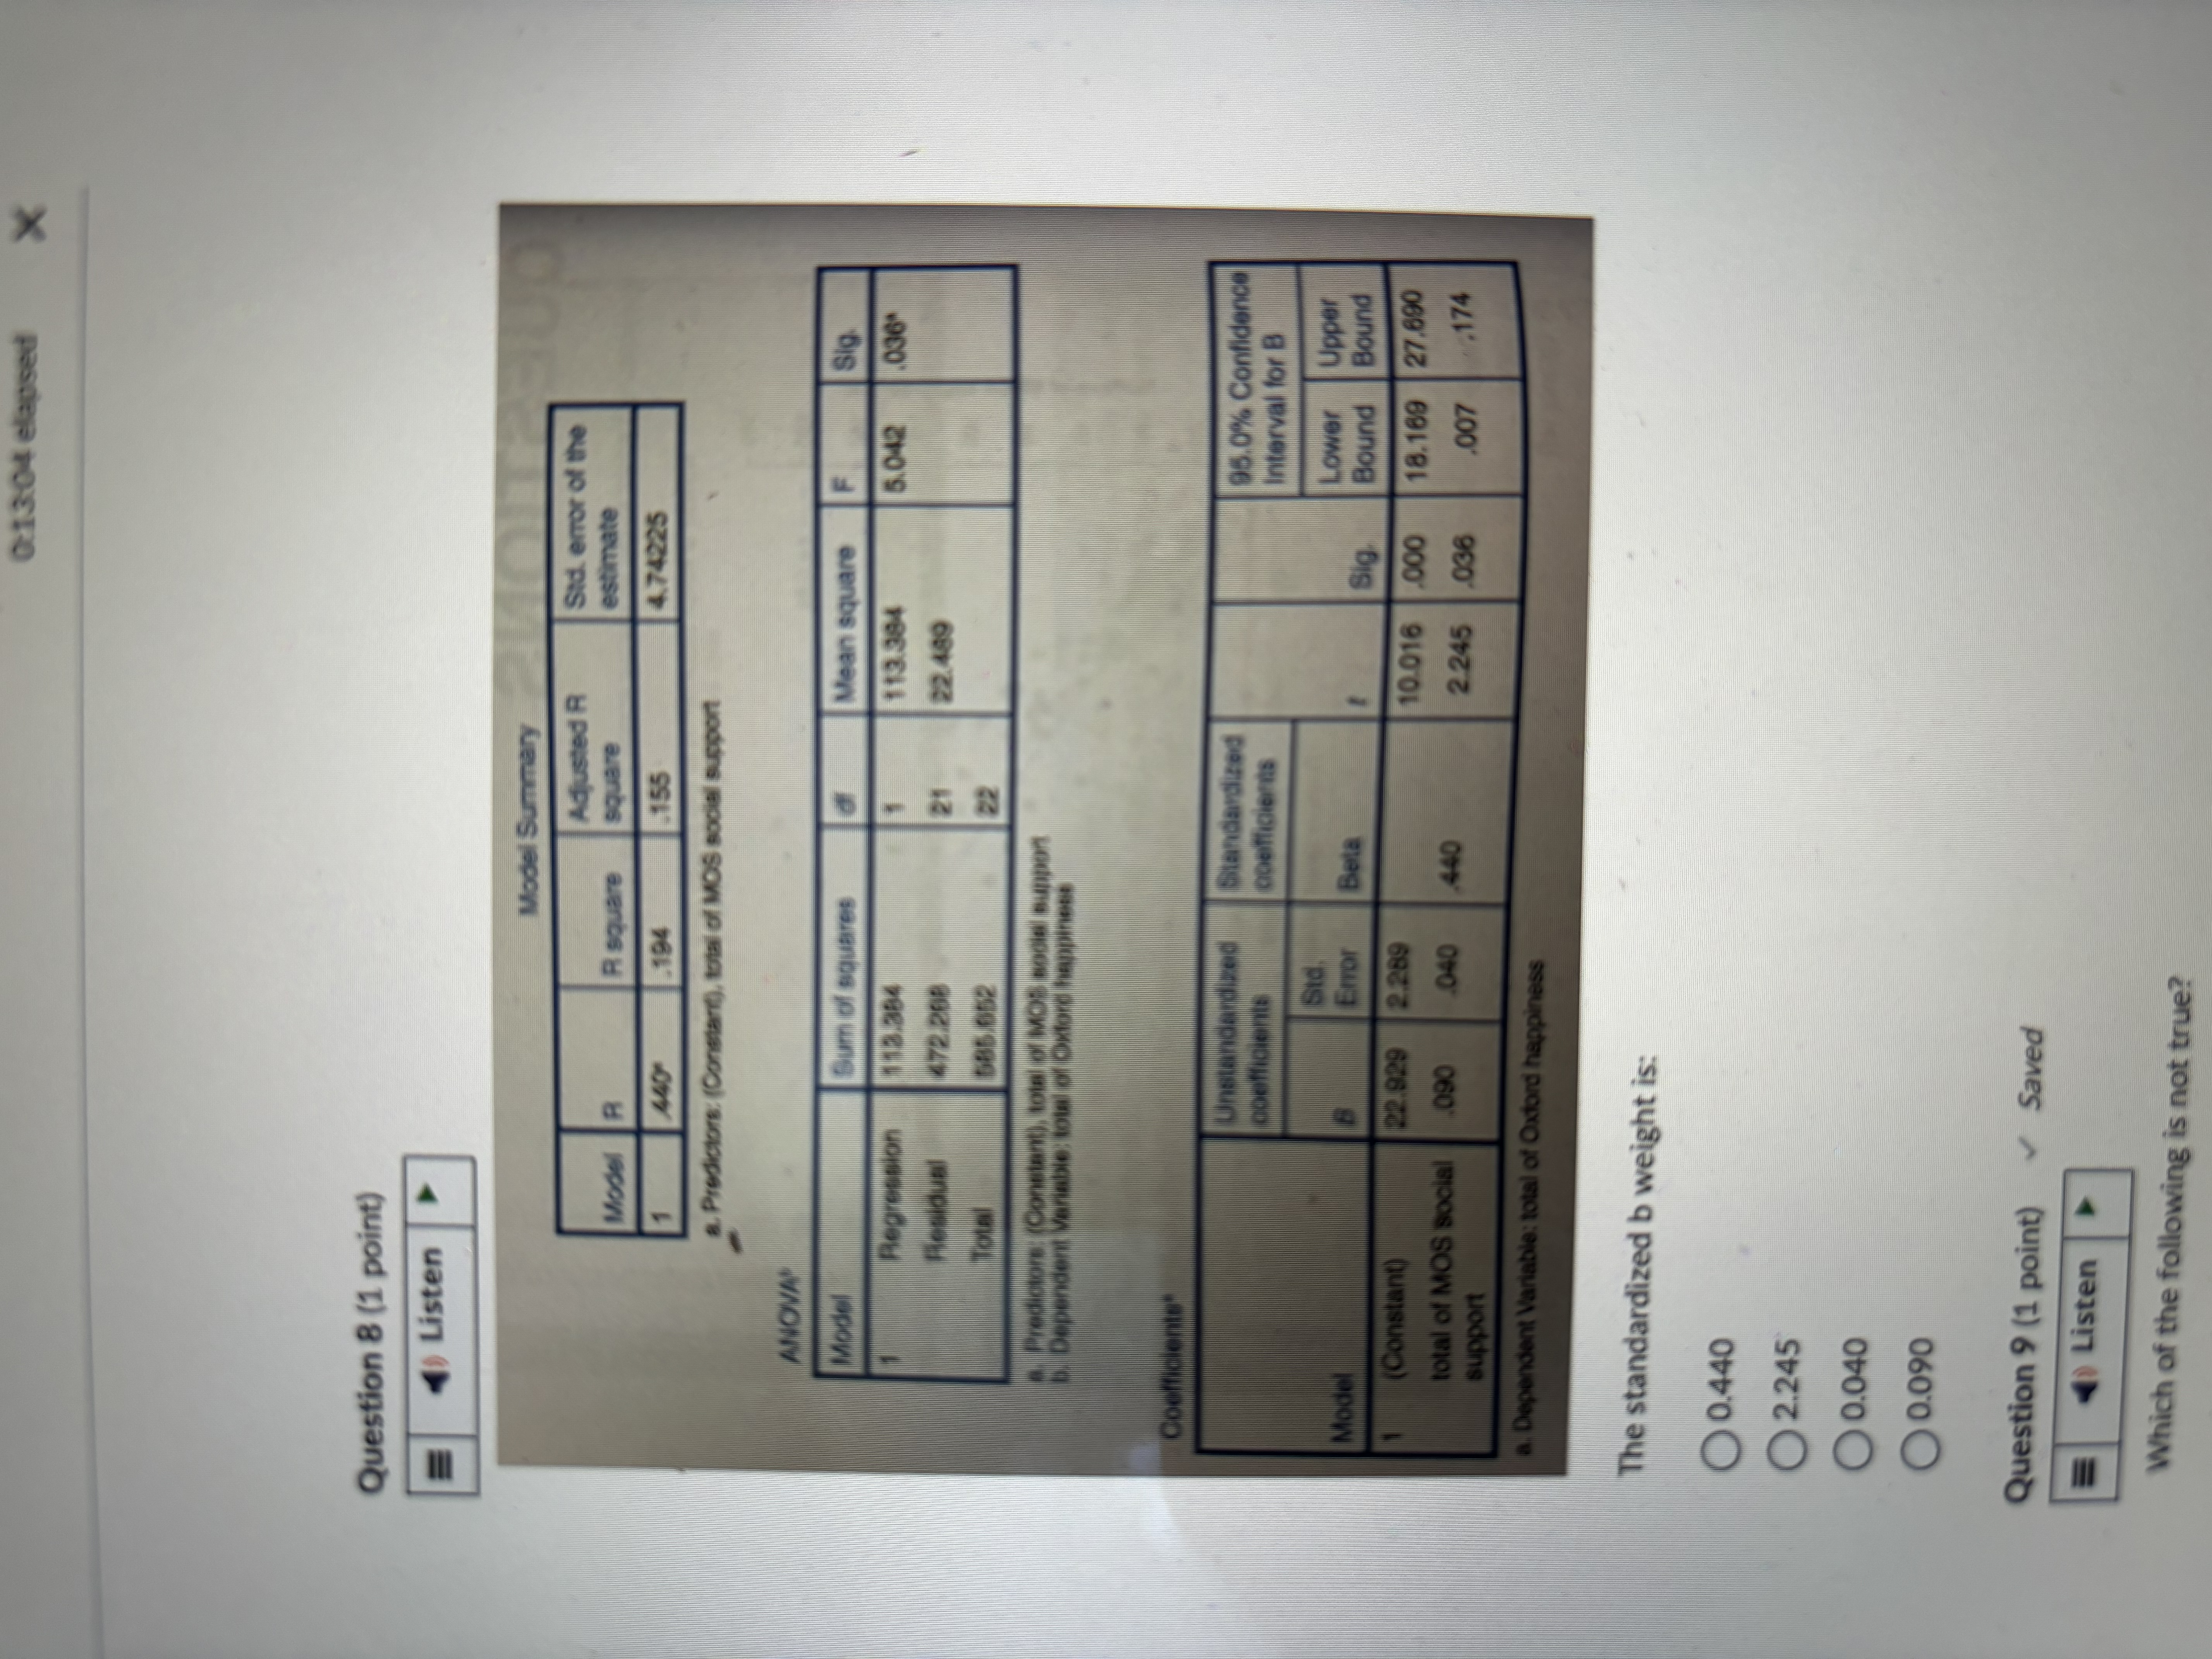
0:12:1 1 elapsed X Question 1 (1 point) ) Listen X Number of MIRSA bacteraemias by total positive blood cultures" examined in all acute NHS Trusts, England: April 2002 to March 2003 180 - 160 -1 =0.86 140 120 100 2000 4000 5000 7000 Positive blood cultures The value of a is: 7000 1000 Cannot tell Oo Question 2 (1 point) Listen Number of MRSA bacteraemias by total positive blood cultures" examined in all acute NHS Trusts, England: April 2002 to March 2003 1800:12:28 elapsed X Question 2 (1 point) Listen Number of M/PISA bactersemias by total positive blood cultures" examined in all acute NHS Trusts, England: April 2002 to March 2003 180 160 -r =0.86 140 120 1000 2000 4000 5000 6000 7000 Positive blood cultures Calculate the slope of the line using the regression line in the scatter plot. The slope of the line, b, is approximately: 0.33 0.66 O0.77 0.55 Question 3 (1 point) Listen Number of MRSA bacteraemias by total positive blood cultures' examined in all acute NHS Trusts, England: April 2002 to March 2003 1800:12:34 elapsed X Question 3 (1 point) Listen Number of M/PISA bacterasmias by total positive blood cultures" examined in all acute NHS Trusts, England: April 2002 to March 2003 180 160 -r = 0.86 140 120 100 1000 2000 SO00 4000 5000 6000 7000 Positive blood cultures For a value of 5500 blood cultures, what is the (approximate) number of predicted MRSA bacteraemias? 160 O 140 120 100 Question 4 (1 point) Listen Model Summary0:12:40 elapsed X Question 4 (1 point) Listen Model Summary Adjusted R Sid, error of the Model R R square square estimate 440 .194 .155 4 74225 a. Predictors: (Constant), tow of MOS social support ANOVA Model Sum of squares Mean square F Sig Regression 1 13.384 113.384 5.042 1036 Residual 472.268 21 22.480 Total 685.652 a Prediction (Constant), tout of MOS soos support D. Dependent Variable: out of Oxford happiness Coefficients Unstandardized Standardized 95.0% Confidence coefficients coefficients Interval for B Std Lower Upper Model Error Beta Sig Bound Bound (Constant) 22.929 2.289 10.016 000 18.169 27.690 total of MOS social 090 040 440 2.245 .174 support 036 .007 a. Dependent Variable: total of Oxford happiness We are 95% confident that the true population regression line will fall between: None of the other answers 18.169 and 27.690 2.245 and 27.690 0.007 and 0.174 Question 5 (1 point) Listen0:12:49 elapsed X Question 5 (1 point) Listen Model Summary Adjusted R Std. error of the Model R R square square estimate 440 .194 .155 4.74225 a. Predictors: (Constant), total of MOS social support ANOVAL Model Sum of squares of Mean square Sig. Regression 113.384 113.384 5.042 036 Residual 472 268 21 22.489 Total 585.652 22 APredictors: (Constant), total of MOS social support b. Dependent Variable: total of Oxford happiness Coefficients Unstandardized Standardized 95.0% Confidence coefficients coefficients Interval for B Std. Lower Upper Model B Error Beta Sig Bound Bound Constant) 22.929 2.289 10.016 000 18.169 27.690 total of MOS social 1090 040 440 2.245 036 -174 support a. Dependent Variable: total of Oxford happiness What is the correlation coefficient for the two variables? 0.440 0.155 4.74 0.194 Question 6 (1 point) Listen Model Summary Adjusted R Std. error of the Model R square square estimate .440 194 -155 4.74225 a. Predictors: (Constant), total of MOS social support0:12:54 elapsed X Question 6 (1 point) () Listen Model Summary Adjusted R Sid. error of the Model R R square square estimate .440 .194 .155 4.74225 a. Predictors: (Constant), total of MOS social support ANOVAL Model Sum of squares of Mean square Sig Regression 1 13.384 113.384 5.042 .036* Residual 472.268 21 22.489 Total 585.652 22 a. Predictors: (Constant), total of MOS social support b. Dependent Variable: total of Oxford happiness Coefficients" Unstandardized Standardized 95.0% Confidence coefficients coefficients Interval for B Std. Lower Upper Model B Error Beta Sig Bound Bound (Constant) 22.929 2.289 10.016 .000 18.169 27.690 total of MOS social 1090 040 440 2.245 036 .007 174 support a. Dependent Variable: total of Oxford happiness What statement is correct? The regression analysis is statistically significant (F 1,22 = 5.042, p-value=0.036). The regression analysis is statistically significant (F 1,21 - 5.042, p-value = 0.036) The regression analysis is not statistically significant (F 1,21 - 5.042, p value=0.036) The regression analysis is not statistically significant (F 1,22 - 5.042, p- value= 0.036 ) . Question 7 (1 point) Listen Model Summary Sid .Question 7 (1 point) Listen Model Summary Adjusted R Sid. error of the Model R estimate .155 474225 a. Predictors. (Constant), to of MOS soon support ANOVAL Model Sum of squares Mean square F Sig Regression 113 384 5.042 036 Residue 22.480 Dependent venable of of Oxford happiness Coefficients" Unstandardized Standardized 95.0% Confidence Interval for B Lower Upper Mode Error Bela Sig Bound Bound (Constant) 22 929 2.289 10.016 DOO 18. 169 27.690 total of MOS social 1090 040 440 2.245 .036 007 .174 support . Dependent Variable: total of Oxford happiness The regression equation is y= None of the other answers 2.289x + 0.040 22.929x + 0.09 0.09x + 22.929 Question 8 (1 point) Listen Summa0:13:04 elapsed X Question 8 (1 point) () Listen Model Summary Adjusted R Sid. error of the Model R R square square estimate 640 .194 155 4.74225 a. Predictors: (Constant), total of MOS social support ANDVAN Model Sum of squares Mean square F Sig Regression 1 13.384 113.384 5.042 036 21 22.489 Total 585 652 Predictors (Constant), tois of MOt social support Dependent Variable; out of Oxford happiness Unstandardized Standardized 95.0% Confidence interval for B Mode Lower Upper Bel Sig Bound Bound (Constant) 22.929 2.289 10.016 000 18.169 27.690 total of MOS social 1090 040 440 2.245 036 support 1007 .174 a. Dependent Variable: total of Oxford happiness The standardized b weight is: 0.440 2.245 O 0.040 0.090 Question 9 (1 point) Saved Listen Which of the following is not true
Step by Step Solution
There are 3 Steps involved in it

Get step-by-step solutions from verified subject matter experts