

Question: 03: Using common size statements help Scott present an appraisal of the company's performance and financial condition vis--vis its key competitors. % of Sales Sales
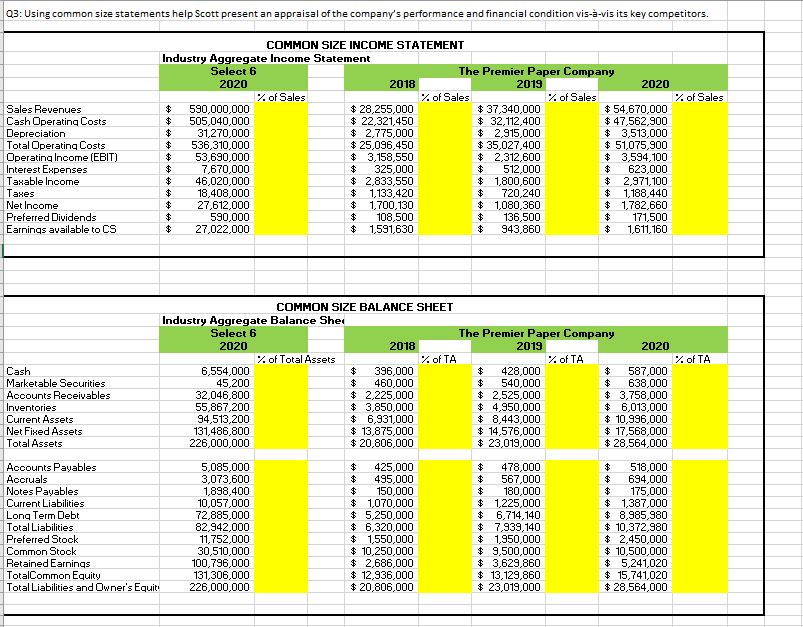
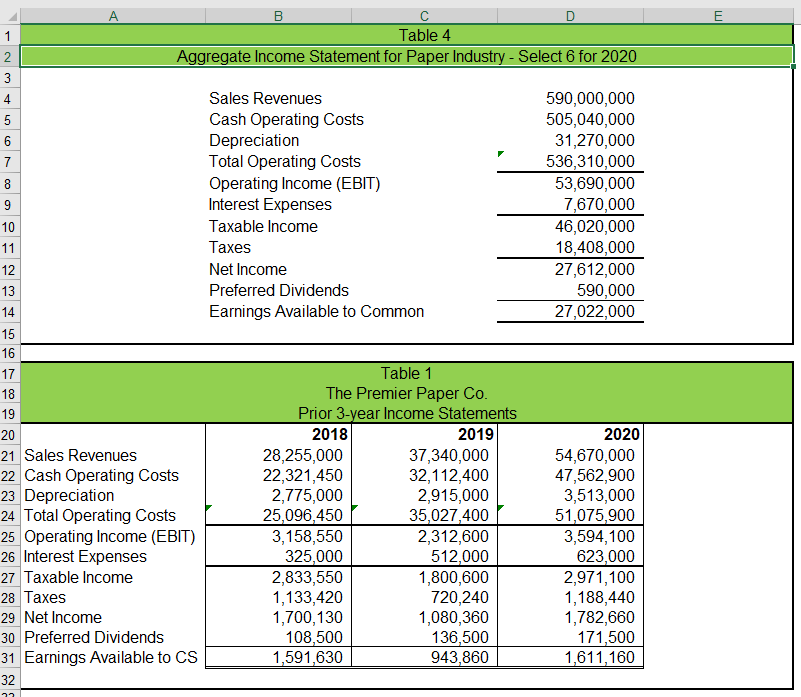
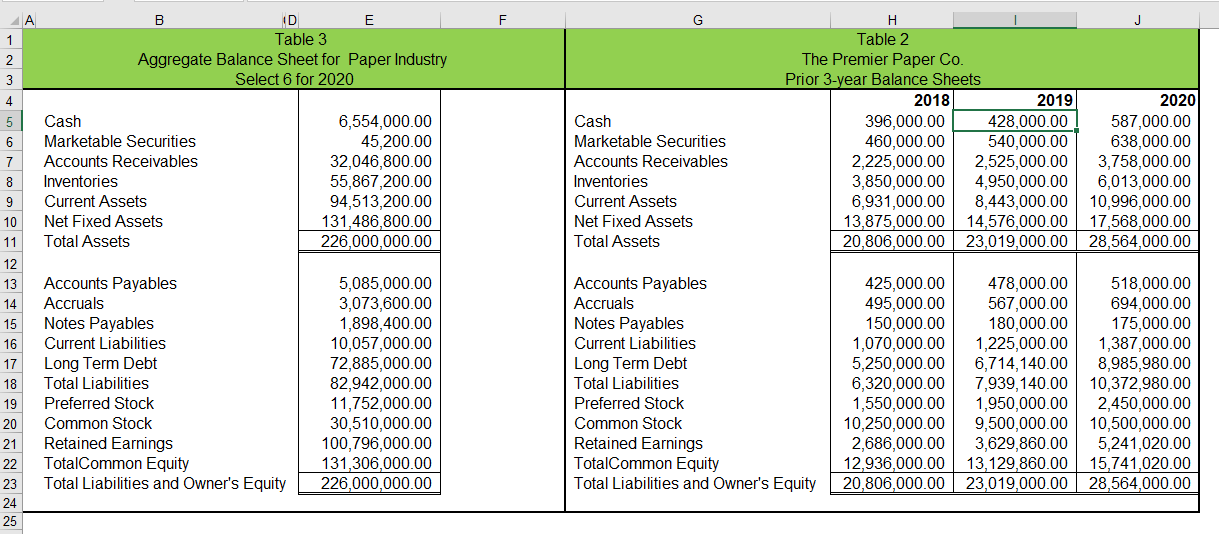
03: Using common size statements help Scott present an appraisal of the company's performance and financial condition vis--vis its key competitors. % of Sales Sales Revenues Cash Operating Costs Depreciation Total Operating Costs Operating Income (EBIT) Interest Expenses Taxable income Taxes Net Income Preferred Dividends Earnings available to CS COMMON SIZE INCOME STATEMENT Industry Aggregate Income Statement Select 6 The Premier Paper Company 2020 2018 2019 2020 % of Sales % of Sales % of Sales $ 590,000,000 $28,255,000 $ 37,340,000 $ 54,670,000 $ 505,040,000 $ 22,321,450 $ 32,112,400 $ 47,562,900 $ 31,270,000 $ 2,775,000 $ 2,915,000 $ 3,513,000 $ 536,310,000 $ 25,096,450 $ 35,027,400 $ 51,075,900 $ 53,690,000 $ 3,158,550 $ 2,312,600 $ 3,594,100 $ 7,670,000 $ 325,000 $ 512,000 $ 623,000 $ 46,020,000 $ 2,833,550 $ 1,800,600 $ 2,971,100 $ 18,408,000 $ 1.133,420 $ 720.240 $ 1,188,440 $ 27,612,000 $ 1,700,130 $ 1,080,360 $ 1,782,660 590,000 $ 108,500 $ 136,500 $ 171,500 27,022,000 $ 1,591,630 $ 943,860 $ 1,611,160 Cash Marketable Securities Accounts Receivables Inventories Current Assets Net Fixed Assets Total Assets COMMON SIZE BALANCE SHEET Industry Aggregate Balance Shed Select 6 The Premier Paper Company 2020 2018 2019 2020 % of Total Assets % of TA % of TA % of TA 6,554,000 $ 396,000 428,000 $ 587,000 45,200 460,000 $ 540,000 638,000 32,046,800 $ 2,225,000 $ 2,525,000 $ 3,758,000 55,867,200 $ 3,850,000 $ 4,950,000 $ 6,013,000 94,513,200 $ 6,931,000 $ 8,443,000 $ 10,996,000 131,486,800 $ 13,875,000 $ 14,576,000 $ 17,568,000 226,000,000 $ 20,806,000 $ 23,019,000 $ 28,564,000 Accounts Payables Accruals Notes Payables Current Liabilities Long Term Debt Total Liabilities Preferred Stock Common Stock Retained Earnings TotalCommon Equity Total Liabilities and Owner's Equit 5,085,000 3,073,600 1,898,400 10,057,000 72,885,000 82,942,000 11,752,000 30,510,000 100,796,000 131,306,000 226,000,000 $ 425,000 $ 495,000 $ 150,000 $ 1,070,000 $ 5,250,000 $ 6,320,000 $ 1,550,000 $ 10,250,000 $ 2,686,000 $ 12,936,000 $ 20,806,000 $ 478,000 $ 567,000 $ 180,000 $ 1,225,000 $ 6,714,140 $ 7,939,140 $ 1,950,000 $ 9,500,000 $ 3,629,860 $ 13,129,860 $ 23,019,000 $ 518,000 $ 694,000 $ 175,000 $ 1,387,000 $ 8,985,980 $ 10,372,980 $ 2,450,000 $ 10,500,000 $ 5,241,020 $ 15,741,020 $ 28,564,000 A E 1 2 3 Table 4 Aggregate Income Statement for Paper Industry - Select 6 for 2020 0 0 w N = 4 Sales Revenues Cash Operating costs Depreciation Total Operating costs Operating Income (EBIT) Interest Expenses Taxable income Taxes Net Income Preferred Dividends Earnings Available to Common 590,000,000 505,040,000 31,270,000 536,310,000 53,690,000 7,670,000 46,020,000 18,408,000 27,612,000 590,000 27,022,000 5 6 7 8 9 10 11 12 13 14 15 16 17 18 19 20 21 Sales Revenues 22 Cash Operating Costs 23 Depreciation 24 Total Operating Costs 25 Operating Income (EBIT) 26 Interest Expenses 27 Taxable income 28 Taxes 29 Net Income 30 Preferred Dividends 31 Earnings Available to CS 32 Table 1 The Premier Paper Co. Prior 3-year Income Statements 2018 2019 28,255,000 37,340,000 22,321,450 32,112,400 2,775,000 2,915,000 25,096,450 35,027,400 3,158,550 2,312,600 325,000 512,000 2,833,550 1,800,600 1,133,420 720,240 1,700,130 1,080,360 108,500 136,500 1,591,630 943,860 2020 54,670,000 47,562,900 3,513,000 51,075,900 3,594,100 623,000 2,971,100 1,188,440 1,782,660 171,500 1,611,160 F G 1 2 3 4 B ID E Table 3 Aggregate Balance Sheet for Paper Industry Select 6 for 2020 Cash Marketable Securities Accounts Receivables Inventories Current Assets Net Fixed Assets Total Assets 6,554,000.00 45,200.00 32,046,800.00 55,867,200.00 94,513,200.00 131,486,800.00 226,000,000.00 Cash Marketable Securities Accounts Receivables Inventories Current Assets Net Fixed Assets Total Assets H Table 2 The Premier Paper Co. Prior 3-year Balance Sheets 2018 2019 2020 396,000.00 428,000.00 587,000.00 460,000.00 540,000.00 638,000.00 2,225,000.00 2,525,000.00 3,758,000.00 3,850,000.00 4,950,000.00 6,013,000.00 6,931,000.00 8,443,000.00 10,996,000.00 13,875,000.00 14,576,000.00 17,568,000.00 20,806,000.00 23,019,000.00 28,564,000.00 5 6 7 8 9 10 11 12 13 14 15 16 17 18 19 20 21 22 23 24 25 Accounts Payables Accruals Notes Payables Current Liabilities Long Term Debt Total Liabilities Preferred Stock Common Stock Retained Earnings TotalCommon Equity Total Liabilities and Owner's Equity 5,085,000.00 3,073,600.00 1,898,400.00 10,057,000.00 72,885,000.00 82,942,000.00 11,752,000.00 30,510,000.00 100,796,000.00 131,306,000.00 226,000,000.00 Accounts Payables Accruals Notes Payables Current Liabilities Long Term Debt Total Liabilities Preferred Stock Common Stock Retained Earnings TotalCommon Equity Total Liabilities and Owner's Equity 425,000.00 478,000.00 518,000.00 495,000.00 567,000.00 694,000.00 150,000.00 180,000.00 175,000.00 1,070,000.00 1,225,000.00 1,387,000.00 5,250,000.00 6,714,140.00 8,985,980.00 6,320,000.00 7,939,140.00 10,372,980.00 1,550,000.00 1,950,000.00 2,450,000.00 10,250,000.00 9,500,000.00 10,500,000.00 2,686,000.00 3,629,860.00 5,241,020.00 12,936,000.00 13,129,860.00 15,741,020.00 20,806,000.00 23,019,000.00 28,564,000.00 03: Using common size statements help Scott present an appraisal of the company's performance and financial condition vis--vis its key competitors. % of Sales Sales Revenues Cash Operating Costs Depreciation Total Operating Costs Operating Income (EBIT) Interest Expenses Taxable income Taxes Net Income Preferred Dividends Earnings available to CS COMMON SIZE INCOME STATEMENT Industry Aggregate Income Statement Select 6 The Premier Paper Company 2020 2018 2019 2020 % of Sales % of Sales % of Sales $ 590,000,000 $28,255,000 $ 37,340,000 $ 54,670,000 $ 505,040,000 $ 22,321,450 $ 32,112,400 $ 47,562,900 $ 31,270,000 $ 2,775,000 $ 2,915,000 $ 3,513,000 $ 536,310,000 $ 25,096,450 $ 35,027,400 $ 51,075,900 $ 53,690,000 $ 3,158,550 $ 2,312,600 $ 3,594,100 $ 7,670,000 $ 325,000 $ 512,000 $ 623,000 $ 46,020,000 $ 2,833,550 $ 1,800,600 $ 2,971,100 $ 18,408,000 $ 1.133,420 $ 720.240 $ 1,188,440 $ 27,612,000 $ 1,700,130 $ 1,080,360 $ 1,782,660 590,000 $ 108,500 $ 136,500 $ 171,500 27,022,000 $ 1,591,630 $ 943,860 $ 1,611,160 Cash Marketable Securities Accounts Receivables Inventories Current Assets Net Fixed Assets Total Assets COMMON SIZE BALANCE SHEET Industry Aggregate Balance Shed Select 6 The Premier Paper Company 2020 2018 2019 2020 % of Total Assets % of TA % of TA % of TA 6,554,000 $ 396,000 428,000 $ 587,000 45,200 460,000 $ 540,000 638,000 32,046,800 $ 2,225,000 $ 2,525,000 $ 3,758,000 55,867,200 $ 3,850,000 $ 4,950,000 $ 6,013,000 94,513,200 $ 6,931,000 $ 8,443,000 $ 10,996,000 131,486,800 $ 13,875,000 $ 14,576,000 $ 17,568,000 226,000,000 $ 20,806,000 $ 23,019,000 $ 28,564,000 Accounts Payables Accruals Notes Payables Current Liabilities Long Term Debt Total Liabilities Preferred Stock Common Stock Retained Earnings TotalCommon Equity Total Liabilities and Owner's Equit 5,085,000 3,073,600 1,898,400 10,057,000 72,885,000 82,942,000 11,752,000 30,510,000 100,796,000 131,306,000 226,000,000 $ 425,000 $ 495,000 $ 150,000 $ 1,070,000 $ 5,250,000 $ 6,320,000 $ 1,550,000 $ 10,250,000 $ 2,686,000 $ 12,936,000 $ 20,806,000 $ 478,000 $ 567,000 $ 180,000 $ 1,225,000 $ 6,714,140 $ 7,939,140 $ 1,950,000 $ 9,500,000 $ 3,629,860 $ 13,129,860 $ 23,019,000 $ 518,000 $ 694,000 $ 175,000 $ 1,387,000 $ 8,985,980 $ 10,372,980 $ 2,450,000 $ 10,500,000 $ 5,241,020 $ 15,741,020 $ 28,564,000 A E 1 2 3 Table 4 Aggregate Income Statement for Paper Industry - Select 6 for 2020 0 0 w N = 4 Sales Revenues Cash Operating costs Depreciation Total Operating costs Operating Income (EBIT) Interest Expenses Taxable income Taxes Net Income Preferred Dividends Earnings Available to Common 590,000,000 505,040,000 31,270,000 536,310,000 53,690,000 7,670,000 46,020,000 18,408,000 27,612,000 590,000 27,022,000 5 6 7 8 9 10 11 12 13 14 15 16 17 18 19 20 21 Sales Revenues 22 Cash Operating Costs 23 Depreciation 24 Total Operating Costs 25 Operating Income (EBIT) 26 Interest Expenses 27 Taxable income 28 Taxes 29 Net Income 30 Preferred Dividends 31 Earnings Available to CS 32 Table 1 The Premier Paper Co. Prior 3-year Income Statements 2018 2019 28,255,000 37,340,000 22,321,450 32,112,400 2,775,000 2,915,000 25,096,450 35,027,400 3,158,550 2,312,600 325,000 512,000 2,833,550 1,800,600 1,133,420 720,240 1,700,130 1,080,360 108,500 136,500 1,591,630 943,860 2020 54,670,000 47,562,900 3,513,000 51,075,900 3,594,100 623,000 2,971,100 1,188,440 1,782,660 171,500 1,611,160 F G 1 2 3 4 B ID E Table 3 Aggregate Balance Sheet for Paper Industry Select 6 for 2020 Cash Marketable Securities Accounts Receivables Inventories Current Assets Net Fixed Assets Total Assets 6,554,000.00 45,200.00 32,046,800.00 55,867,200.00 94,513,200.00 131,486,800.00 226,000,000.00 Cash Marketable Securities Accounts Receivables Inventories Current Assets Net Fixed Assets Total Assets H Table 2 The Premier Paper Co. Prior 3-year Balance Sheets 2018 2019 2020 396,000.00 428,000.00 587,000.00 460,000.00 540,000.00 638,000.00 2,225,000.00 2,525,000.00 3,758,000.00 3,850,000.00 4,950,000.00 6,013,000.00 6,931,000.00 8,443,000.00 10,996,000.00 13,875,000.00 14,576,000.00 17,568,000.00 20,806,000.00 23,019,000.00 28,564,000.00 5 6 7 8 9 10 11 12 13 14 15 16 17 18 19 20 21 22 23 24 25 Accounts Payables Accruals Notes Payables Current Liabilities Long Term Debt Total Liabilities Preferred Stock Common Stock Retained Earnings TotalCommon Equity Total Liabilities and Owner's Equity 5,085,000.00 3,073,600.00 1,898,400.00 10,057,000.00 72,885,000.00 82,942,000.00 11,752,000.00 30,510,000.00 100,796,000.00 131,306,000.00 226,000,000.00 Accounts Payables Accruals Notes Payables Current Liabilities Long Term Debt Total Liabilities Preferred Stock Common Stock Retained Earnings TotalCommon Equity Total Liabilities and Owner's Equity 425,000.00 478,000.00 518,000.00 495,000.00 567,000.00 694,000.00 150,000.00 180,000.00 175,000.00 1,070,000.00 1,225,000.00 1,387,000.00 5,250,000.00 6,714,140.00 8,985,980.00 6,320,000.00 7,939,140.00 10,372,980.00 1,550,000.00 1,950,000.00 2,450,000.00 10,250,000.00 9,500,000.00 10,500,000.00 2,686,000.00 3,629,860.00 5,241,020.00 12,936,000.00 13,129,860.00 15,741,020.00 20,806,000.00 23,019,000.00 28,564,000.00
Step by Step Solution
There are 3 Steps involved in it

Get step-by-step solutions from verified subject matter experts