

05 Guesion No: 02 a). Briefly explain the terms diameter and 90% effective diameter in the...
Fantastic news! We've Found the answer you've been seeking!
Question:
Transcribed Image Text:
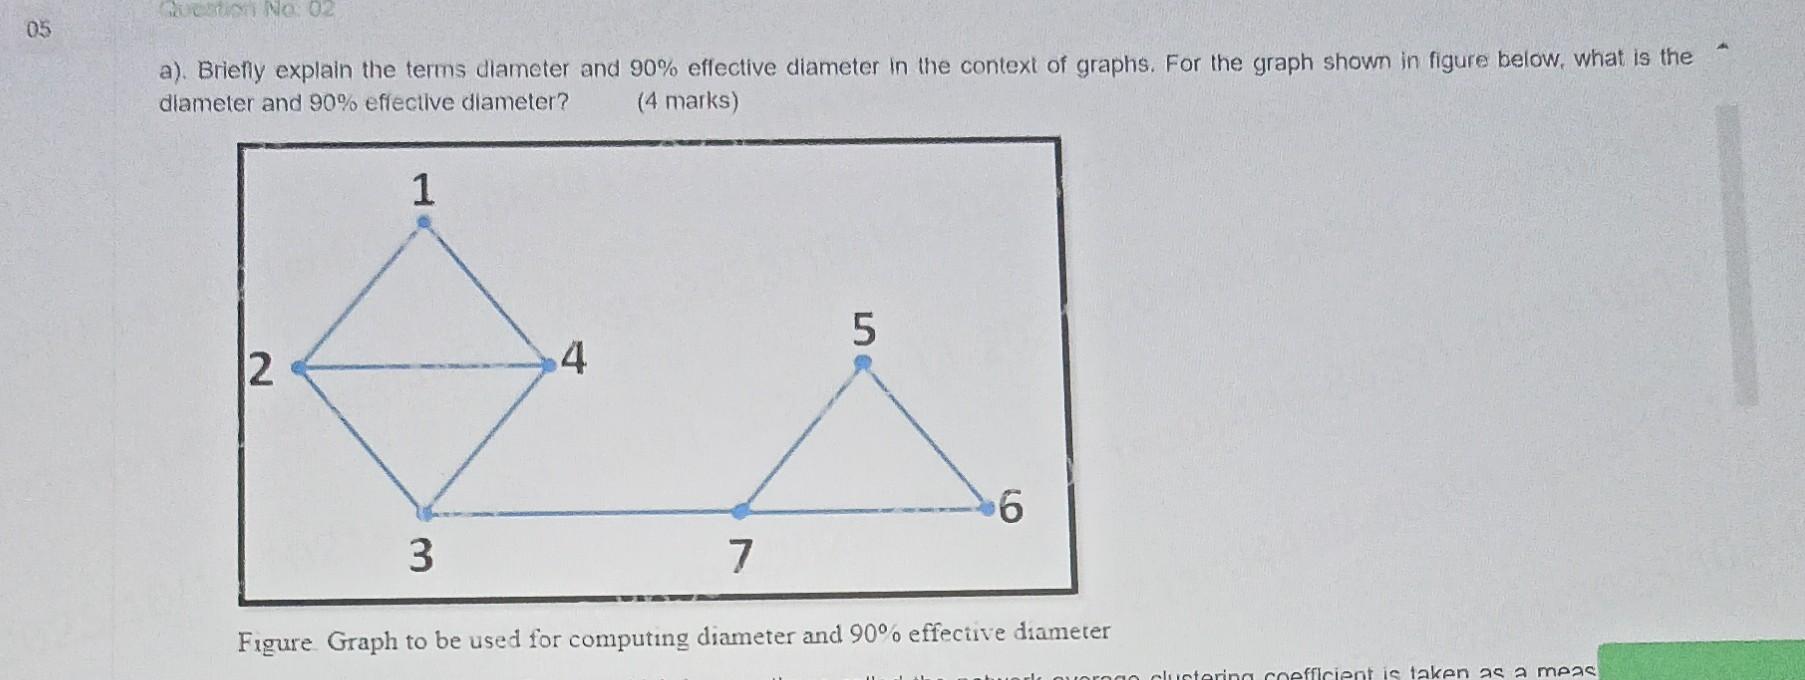
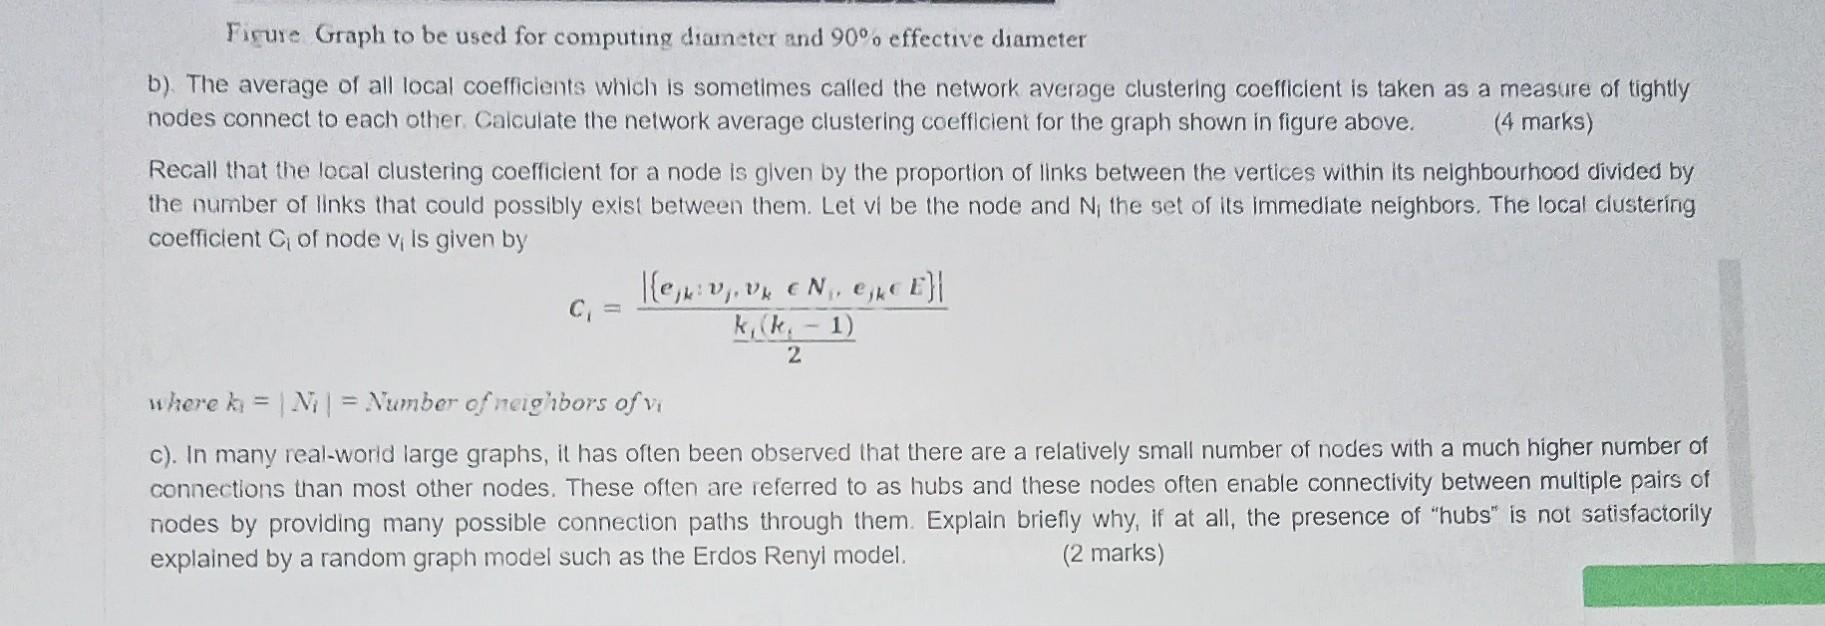
05 Guesion No: 02 a). Briefly explain the terms diameter and 90% effective diameter in the context of graphs. For the graph shown in figure below, what is the diameter and 90% effective diameter? (4 marks) 1 2 3 4 5 6 7 Figure Graph to be used for computing diameter and 90% effective diameter clustering .coefficient is taken as a meas Figure Graph to be used for computing diameter and 90% effective diameter b). The average of all local coefficients which is sometimes called the network average clustering coefficient is taken as a measure of tightly nodes connect to each other. Calculate the network average clustering coefficient for the graph shown in figure above. (4 marks) Recall that the local clustering coefficient for a node is given by the proportion of links between the vertices within its neighbourhood divided by the number of links that could possibly exist between them. Let vi be the node and N, the set of its immediate neighbors. The local clustering coefficient C of node v, is given by C₁ [e₁v₁, v € N₁, €₁ € E}| 1) k, (k 2 where k = | N₁ | Number of neighbors of vi c). In many real-world large graphs, it has often been observed that there are a relatively small number of nodes with a much higher number of connections than most other nodes. These often are referred to as hubs and these nodes often enable connectivity between multiple pairs of nodes by providing many possible connection paths through them. Explain briefly why, if at all, the presence of "hubs" is not satisfactorily explained by a random graph model such as the Erdos Renyi model. (2 marks) 05 Gucsuon No: 02 a). Briefly explain the terms diameter and 90% effective diameter in the context of graphs. For the graph shown in figure below, what is the diameter and 90% effective diameter? (4 marks) 1 2 3 4 5 6 7 Figure Graph to be used for computing diameter and 90% effective diameter clustering. coefficient is taken as a meas Figure Graph to be used for computing diameter and 90% effective diameter b). The average of all local coefficients which is sometimes called the network average clustering coefficient is taken as a measure of tightly nodes connect to each other. Calculate the network average clustering coefficient for the graph shown in figure above. (4 marks) Recall that the local clustering coefficient for a node is given by the proportion of links between the vertices within its neighbourhood divided by the number of links that could possibly exist between them. Let vi be the node and N, the set of its immediate neighbors. The local clustering coefficient C of node v, is given by C₁ [e₁v₁, v k, (k 2 N₁, €₁ € E}| 1) where k = | N₁ | = Number of neighbors of vi c). In many real-world large graphs, it has often been observed that there are a relatively small number of nodes with a much higher number of connections than most other nodes. These often are referred to as hubs and these nodes often enable connectivity between multiple pairs of nodes by providing many possible connection paths through them. Explain briefly why, if at all, the presence of "hubs" is not satisfactorily explained by a random graph model such as the Erdos Renyi model. (2 marks) 05 Guesion No: 02 a). Briefly explain the terms diameter and 90% effective diameter in the context of graphs. For the graph shown in figure below, what is the diameter and 90% effective diameter? (4 marks) 1 2 3 4 5 6 7 Figure Graph to be used for computing diameter and 90% effective diameter clustering .coefficient is taken as a meas Figure Graph to be used for computing diameter and 90% effective diameter b). The average of all local coefficients which is sometimes called the network average clustering coefficient is taken as a measure of tightly nodes connect to each other. Calculate the network average clustering coefficient for the graph shown in figure above. (4 marks) Recall that the local clustering coefficient for a node is given by the proportion of links between the vertices within its neighbourhood divided by the number of links that could possibly exist between them. Let vi be the node and N, the set of its immediate neighbors. The local clustering coefficient C of node v, is given by C₁ [e₁v₁, v € N₁, €₁ € E}| 1) k, (k 2 where k = | N₁ | Number of neighbors of vi c). In many real-world large graphs, it has often been observed that there are a relatively small number of nodes with a much higher number of connections than most other nodes. These often are referred to as hubs and these nodes often enable connectivity between multiple pairs of nodes by providing many possible connection paths through them. Explain briefly why, if at all, the presence of "hubs" is not satisfactorily explained by a random graph model such as the Erdos Renyi model. (2 marks) 05 Gucsuon No: 02 a). Briefly explain the terms diameter and 90% effective diameter in the context of graphs. For the graph shown in figure below, what is the diameter and 90% effective diameter? (4 marks) 1 2 3 4 5 6 7 Figure Graph to be used for computing diameter and 90% effective diameter clustering. coefficient is taken as a meas Figure Graph to be used for computing diameter and 90% effective diameter b). The average of all local coefficients which is sometimes called the network average clustering coefficient is taken as a measure of tightly nodes connect to each other. Calculate the network average clustering coefficient for the graph shown in figure above. (4 marks) Recall that the local clustering coefficient for a node is given by the proportion of links between the vertices within its neighbourhood divided by the number of links that could possibly exist between them. Let vi be the node and N, the set of its immediate neighbors. The local clustering coefficient C of node v, is given by C₁ [e₁v₁, v k, (k 2 N₁, €₁ € E}| 1) where k = | N₁ | = Number of neighbors of vi c). In many real-world large graphs, it has often been observed that there are a relatively small number of nodes with a much higher number of connections than most other nodes. These often are referred to as hubs and these nodes often enable connectivity between multiple pairs of nodes by providing many possible connection paths through them. Explain briefly why, if at all, the presence of "hubs" is not satisfactorily explained by a random graph model such as the Erdos Renyi model. (2 marks)
Expert Answer:
Answer rating: 100% (QA)
b To calculate the network average clustering coefficient for the given graph we need to calculate t... View the full answer

Related Book For 

Posted Date:
Students also viewed these programming questions
-
The graph below displays the distribution of word lengths (number of letters) in the Gettysburg Address, which you explored in Exploration 2.1A. a. Describe the shape of this distribution. b. Based...
-
Find an example of data/claims related to your interests or your work. https://www.wral.com/survey-finds-7-of-north-carolina-teachers-plan-to-quit-after-this-school-year/20319953/ required Summarize...
-
Delta Catfish Company has taken a position in its tax return to claim a tax credit of $10 million (direct reduction in taxes payable) and has determined that its sustainability is more likely than...
-
Suppose U.S government officials are concerned about importing beef that might be contaminated with hoof and mouth disease, and they react by restricting beef from Argentina. Explain the impact of...
-
Farber Company adopted a defined benefit pension plan on January 1, 2019, at which time it awarded retroactive benefits to its employees. This prior service cost amounted to $200,000, which the...
-
Enumerate the functions related to the production cycle.
-
Rouse Chemical has spent $ 241,000 to refine 71,000 gallons of acetone, which can be sold for $ 1.90 a gallon. Alternatively, Rouse Chemical can process the acetone further. This processing will...
-
What is a 3-way match? Part 2: Why is the 3-way match considered an internal control? Part 3: Who is responsible for performing the 3-way match, the Purchasing department, the Receiving department,...
-
(a) For the circuit in Fig. 4.138, obtain the Thevenin equivalent at terminals a-b. (b) Calculate the current in RL = 8(. (c) Find RL for maximum power deliverable to RL. (d) Determine that maximum...
-
Argyle Corporation has a net loss of $-76,400 in 2019. A review of its accounts for 2019 reveals: Dividends declared and paid = $34,800 Depreciation Expense = $40,000 Increase in Accounts Payable =...
-
Your factory has been offered a contract to produce a part for a new printer. The contract would last for 3 years and your cash flows from the contract would be $4.84 million per year. Your upfront...
-
The temporary tax difference is due to a $70,000 sale that could be recognized for GAAP purposes in 2021 but it had to be recognized for tax purposes on a prorata basis through 2023 Sheett a....
-
The following are the accounts of United Forward Trading Limited, a company that engages in Shipping and container services for the years ended 31 December 2014 and 215 respectively. Statements of...
-
In order to calculate the cost of capital, it is necessary to accurately assess the capital structure of a firm. Below is information for estimating the cost of capital for JKM Company. Portion of...
-
Summary : Write a summary of what the financial statements indicate about the companys financial health and performance. Purpose : Discuss the accounting process and the resulting financial...
-
Akramin just graduated with a Master of Engineering in Manufacturing Engineering and landed a new job in Melaka with a starting salary of RM 4,000 per month. There are a number of things that he...
-
The following data give the ages (in years) of all six members of a family. a. Let x denote the age of a member of this family. Write the population distribution of x. b. List all the possible...
-
In March 2012, the Gallup-Healthways Well-Being Index (www.gallup.com/poll/153251/ No-Major-Change-Americans-Exercise-Habits-2011.aspx) reported on exercise habits of Americans. Specifically, they...
-
Consider the null hypothesis H0: = 625. Suppose that a random sample of 29 observations is taken from a normally distributed population with = 32. Using a significance level of .01, show the...
-
A survey found that 26% of U.S. adults believe there is no difference between secured and unsecured wireless networks. (A secured network uses barriers, such as firewalls and passwords, to protect...
-
Fifty-two percent of the women in the UK play video games regularly. You randomly select seven women in the UK. Find the probability that the number of women in the UK who are gamers is (a) exactly...
-
About 10% of workers (ages 16 years and older) in the United States commute to their jobs by carpooling. You randomly select eight workers. What is the probability that exactly four of them carpool...

Study smarter with the SolutionInn App