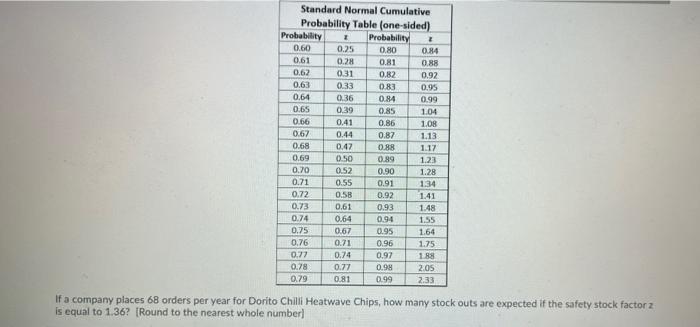
Question: 0.63 1.13 Standard Normal Cumulative Probability Table (one-sided) Probability Probability 2 0.60 0.25 0.80 0.84 0.61 0.28 0.81 0.88 0.62 0.31 0.82 0.92 0.33 0.83

0.63 1.13 Standard Normal Cumulative Probability
0.63 1.13 Standard Normal Cumulative Probability Table (one-sided) Probability Probability 2 0.60 0.25 0.80 0.84 0.61 0.28 0.81 0.88 0.62 0.31 0.82 0.92 0.33 0.83 0.95 0.64 0.36 0.84 0.99 0.65 0.39 0.85 1.04 0.66 0.41 0.86 1.08 0.67 0.44 0.87 0.68 0.47 0.88 1.17 0.69 0.50 0.99 1.23 0.70 0.52 0.90 1.28 0.71 0.55 0.91 1.34 0.72 0.58 0.92 1.41 0.73 0.61 0.93 1.48 0.74 0.64 0.94 1.55 0.75 0.67 0.95 1.64 0.76 0.71 0.96 1.75 0.77 0.74 0.97 1.88 0.78 0.77 0.98 2.05 0.79 0.81 0.99 2.33 H If a company places 68 orders per year for Dorito Chilli Heatwave Chips, how many stock outs are expected if the safety stock factor 2 is equal to 1.36? [Round to the nearest whole number]

Step by Step Solution

There are 3 Steps involved in it

1 Expert Approved Answer
Step: 1 Unlock blur-text-image
Question Has Been Solved by an Expert!

Get step-by-step solutions from verified subject matter experts

Step: 2 Unlock
Step: 3 Unlock

Students Have Also Explored These Related General Management Questions!