Question: 09 (10 pts) - Examine the analysis provided below. (a) Select your own imaginary / hypothetical engineering project example with the same structure as below
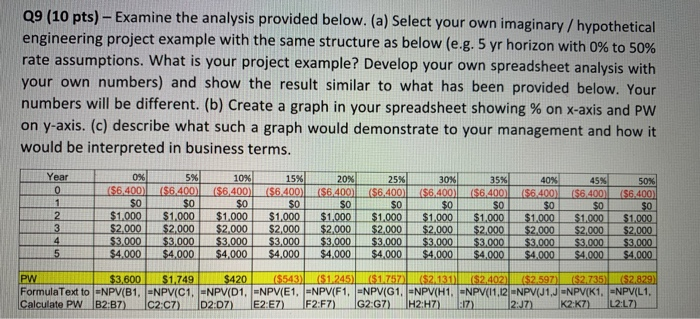
09 (10 pts) - Examine the analysis provided below. (a) Select your own imaginary / hypothetical engineering project example with the same structure as below (e.g. 5 yr horizon with 0% to 50%! rate assumptions. What is your project example? Develop your own spreadsheet analysis with your own numbers) and show the result similar to what has been provided below. Your numbers will be different. (b) Create a graph in your spreadsheet showing % on X-axis and PW on y-axis. (c) describe what such a graph would demonstrate to your management and how it would be interpreted in business terms. Year 0 1 2 3 4 5 ($6.400) $0 $1.000 $2.000 $3.000 $4.000 5% ($6,400 $0 $1,000 $2,000 $3.000 $4,000 10% ($6,400 $0 $1,000 $2,000 $3,000 $4,000 15% ($6.400 $0 $1,000 $2,000 $3.000 $4,000 20% ($6,400 $0 $1,000 $2,000 $3.000 $4,000 25% ($6.400 $0 $1,000 $2,000 $3,000 $4,000 30% 35% ($6.4001156.400 $0 $ $1,000 $1,000 $2,000 $2,000 $3.000 $3.000 $4,000 _$4.000 40% 56.400) $0 $1.000 $2.000 $3.000 $4.000 $6.400 $0 $1.000 $2.000 $3.000 $4.000 50% (56.400) $0 $1.000 $2.000 $3.000 $4.000 PW $3,600 $1,749 $420 ($543) ($1.245) ($1.757 ($2.130 ||$2.402) ($2.597) ($2.735) ($2.829) FormulaText to ENPV(B1. -NPVIC1. NPV(D1. -NPV(E1. ENPV(F1. ENPV(G1, -NPV(H1. -NPV(11,12-NPV(J1,J -NPV/K1, -NPVIL1, Calculate PW B2B7) 02.07) 02.07) E2:E7) F2 F7) G2 G7) H2 H7) :17). 12:37) K2 K7L2L7) 09 (10 pts) - Examine the analysis provided below. (a) Select your own imaginary / hypothetical engineering project example with the same structure as below (e.g. 5 yr horizon with 0% to 50%! rate assumptions. What is your project example? Develop your own spreadsheet analysis with your own numbers) and show the result similar to what has been provided below. Your numbers will be different. (b) Create a graph in your spreadsheet showing % on X-axis and PW on y-axis. (c) describe what such a graph would demonstrate to your management and how it would be interpreted in business terms. Year 0 1 2 3 4 5 ($6.400) $0 $1.000 $2.000 $3.000 $4.000 5% ($6,400 $0 $1,000 $2,000 $3.000 $4,000 10% ($6,400 $0 $1,000 $2,000 $3,000 $4,000 15% ($6.400 $0 $1,000 $2,000 $3.000 $4,000 20% ($6,400 $0 $1,000 $2,000 $3.000 $4,000 25% ($6.400 $0 $1,000 $2,000 $3,000 $4,000 30% 35% ($6.4001156.400 $0 $ $1,000 $1,000 $2,000 $2,000 $3.000 $3.000 $4,000 _$4.000 40% 56.400) $0 $1.000 $2.000 $3.000 $4.000 $6.400 $0 $1.000 $2.000 $3.000 $4.000 50% (56.400) $0 $1.000 $2.000 $3.000 $4.000 PW $3,600 $1,749 $420 ($543) ($1.245) ($1.757 ($2.130 ||$2.402) ($2.597) ($2.735) ($2.829) FormulaText to ENPV(B1. -NPVIC1. NPV(D1. -NPV(E1. ENPV(F1. ENPV(G1, -NPV(H1. -NPV(11,12-NPV(J1,J -NPV/K1, -NPVIL1, Calculate PW B2B7) 02.07) 02.07) E2:E7) F2 F7) G2 G7) H2 H7) :17). 12:37) K2 K7L2L7)