

Question: 09329 A ' 1 Search Based on the Excel output, what conclusion is t' most appropriate? O At the 0.1 level of significance, the sample

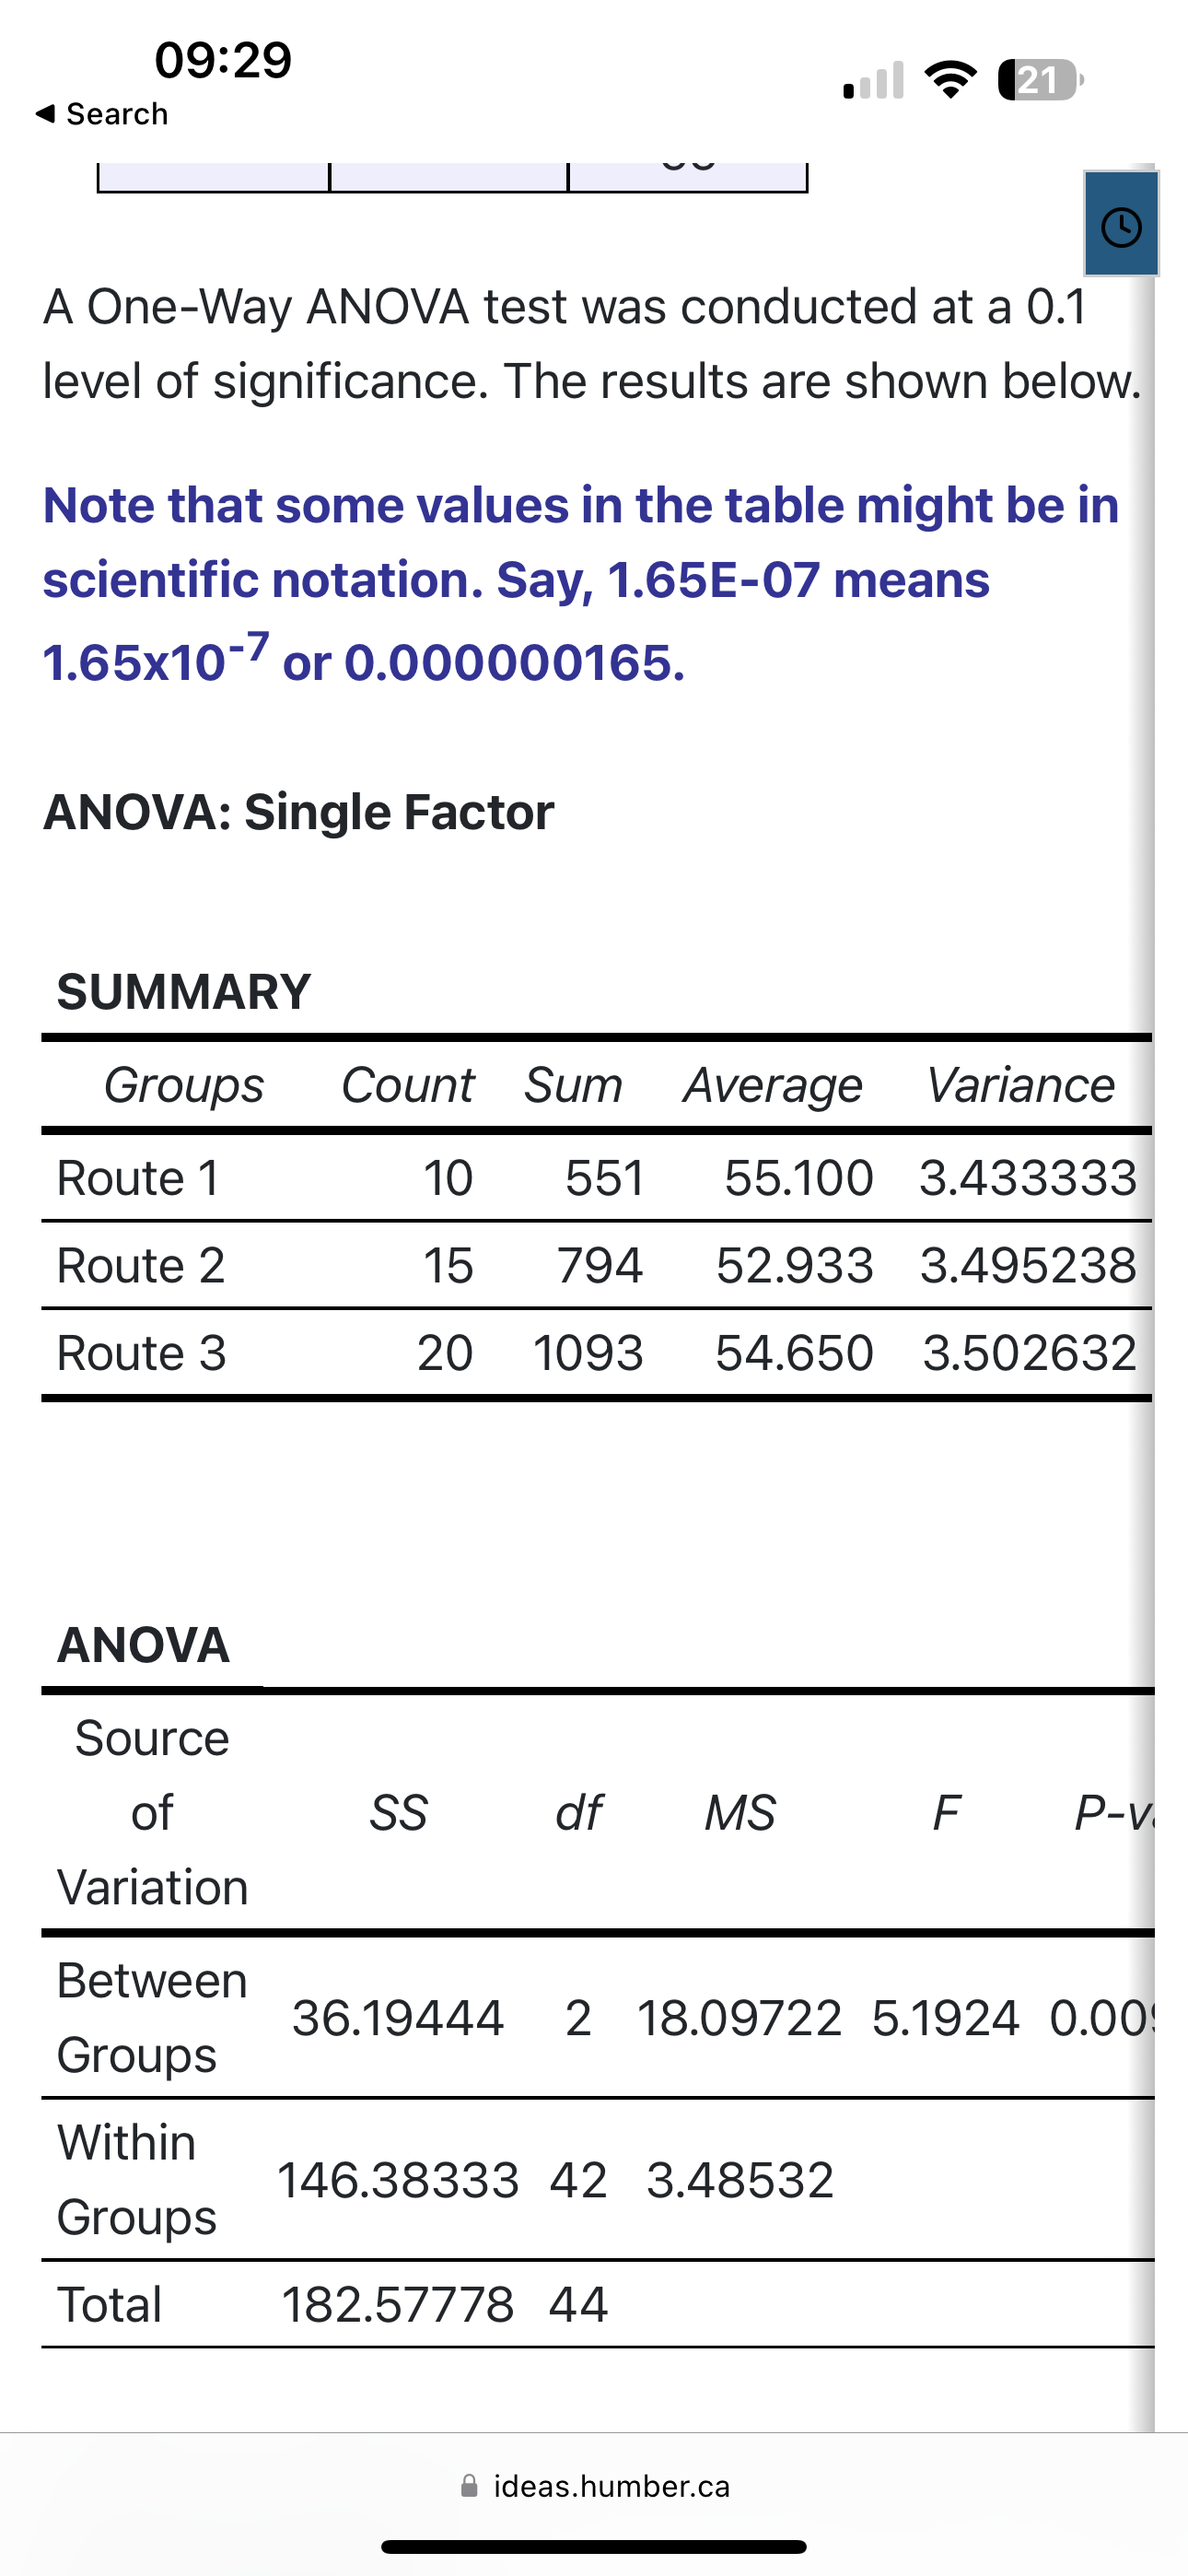
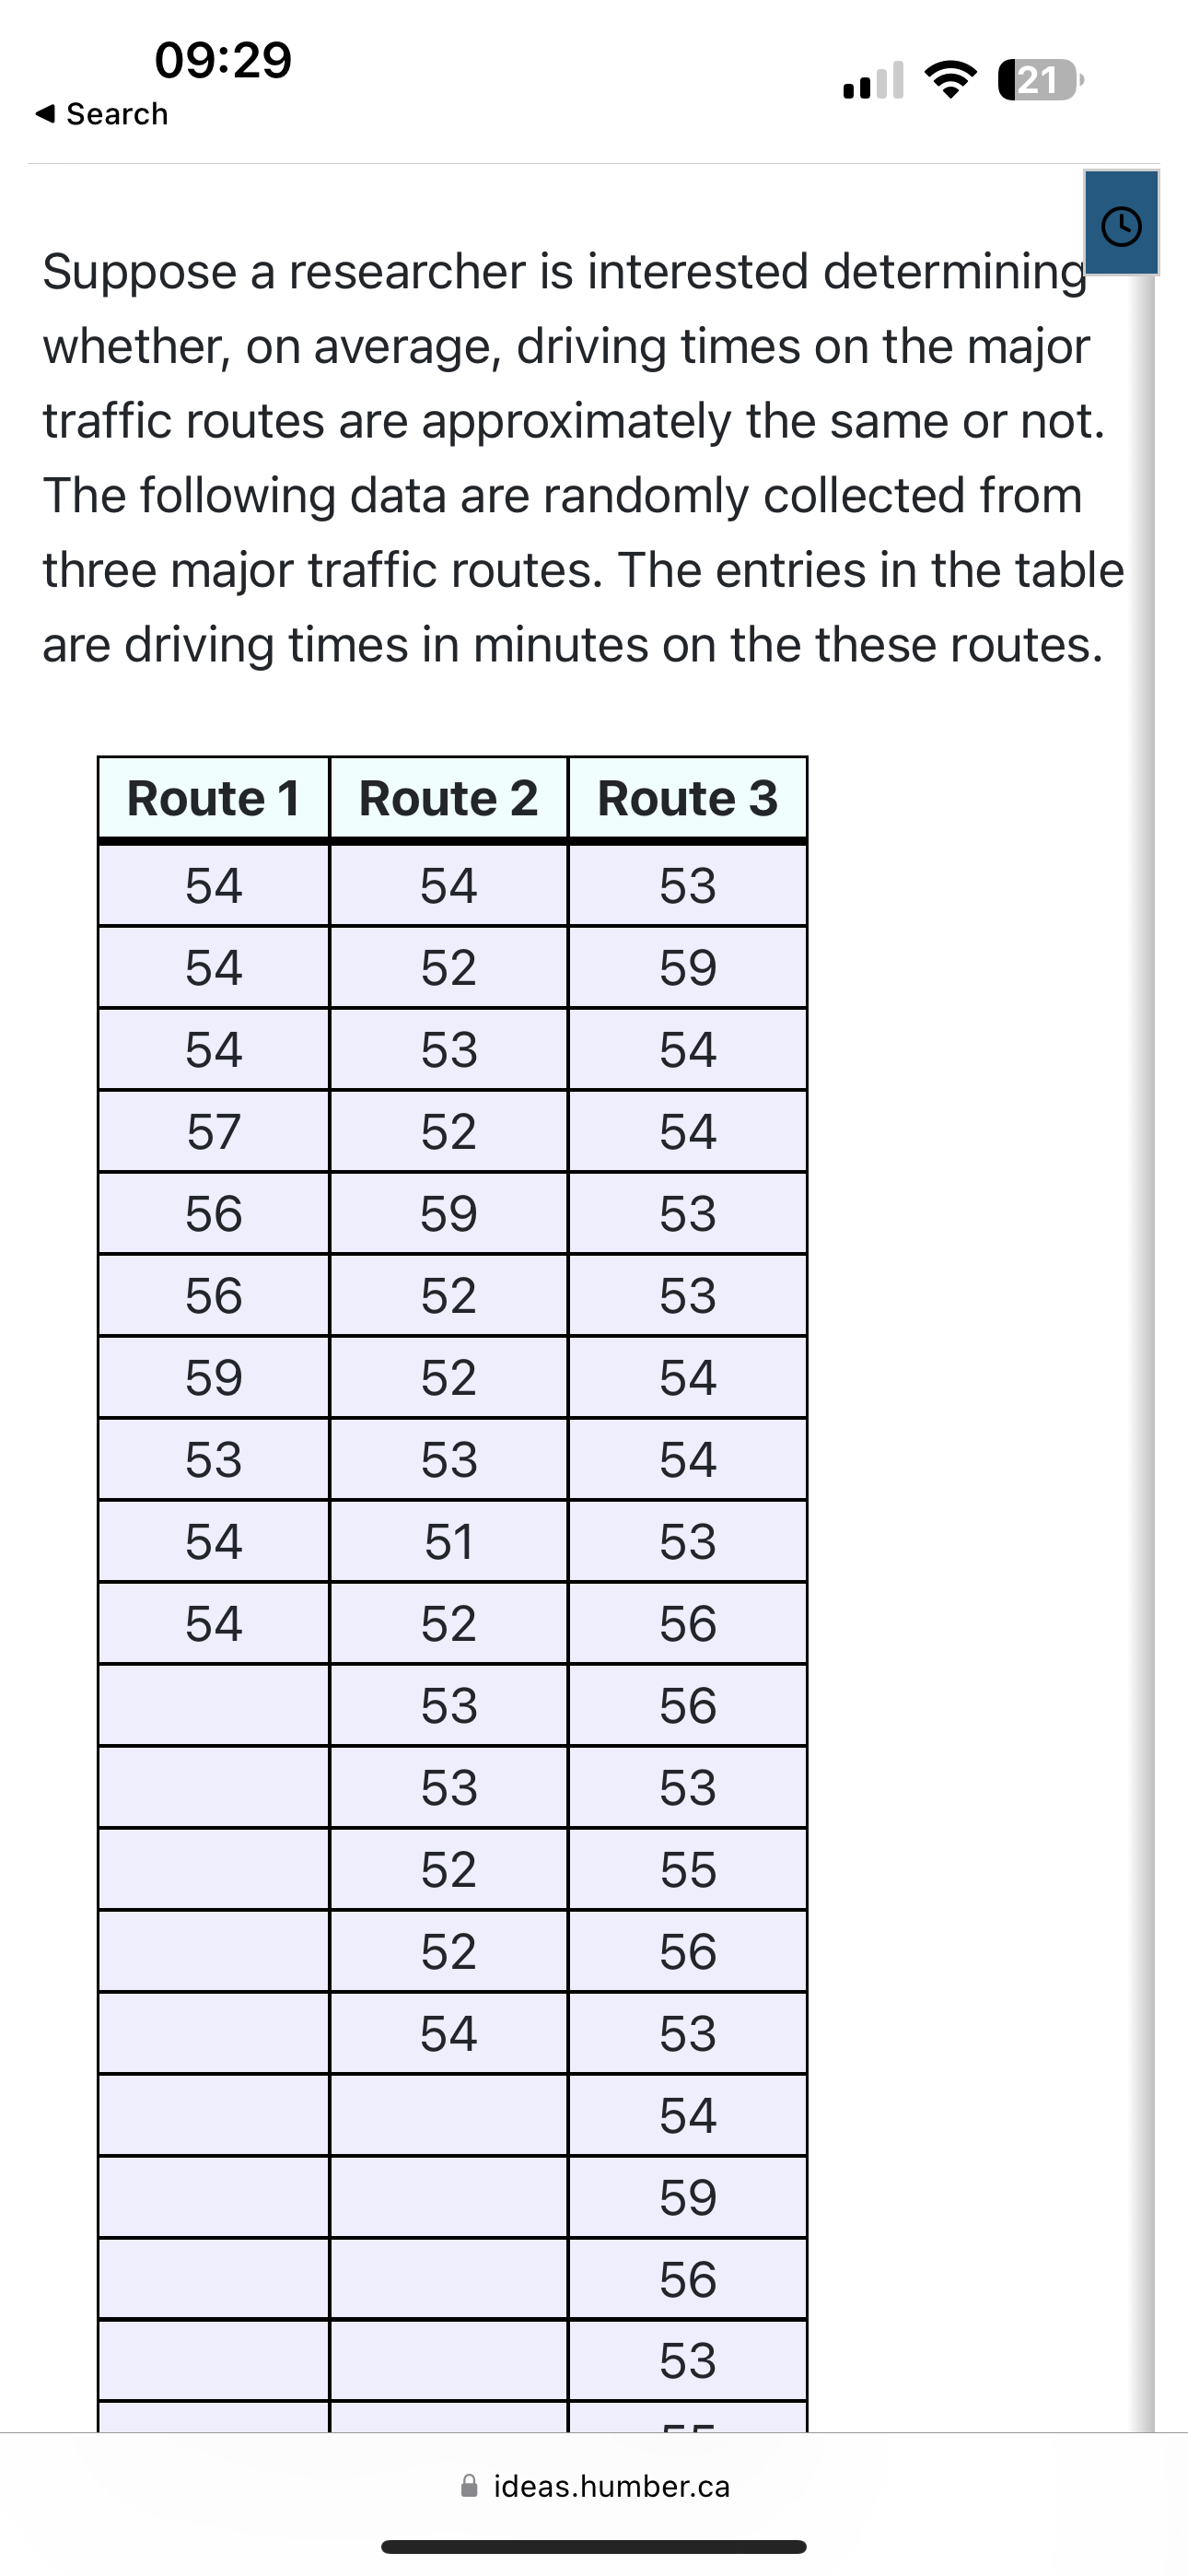
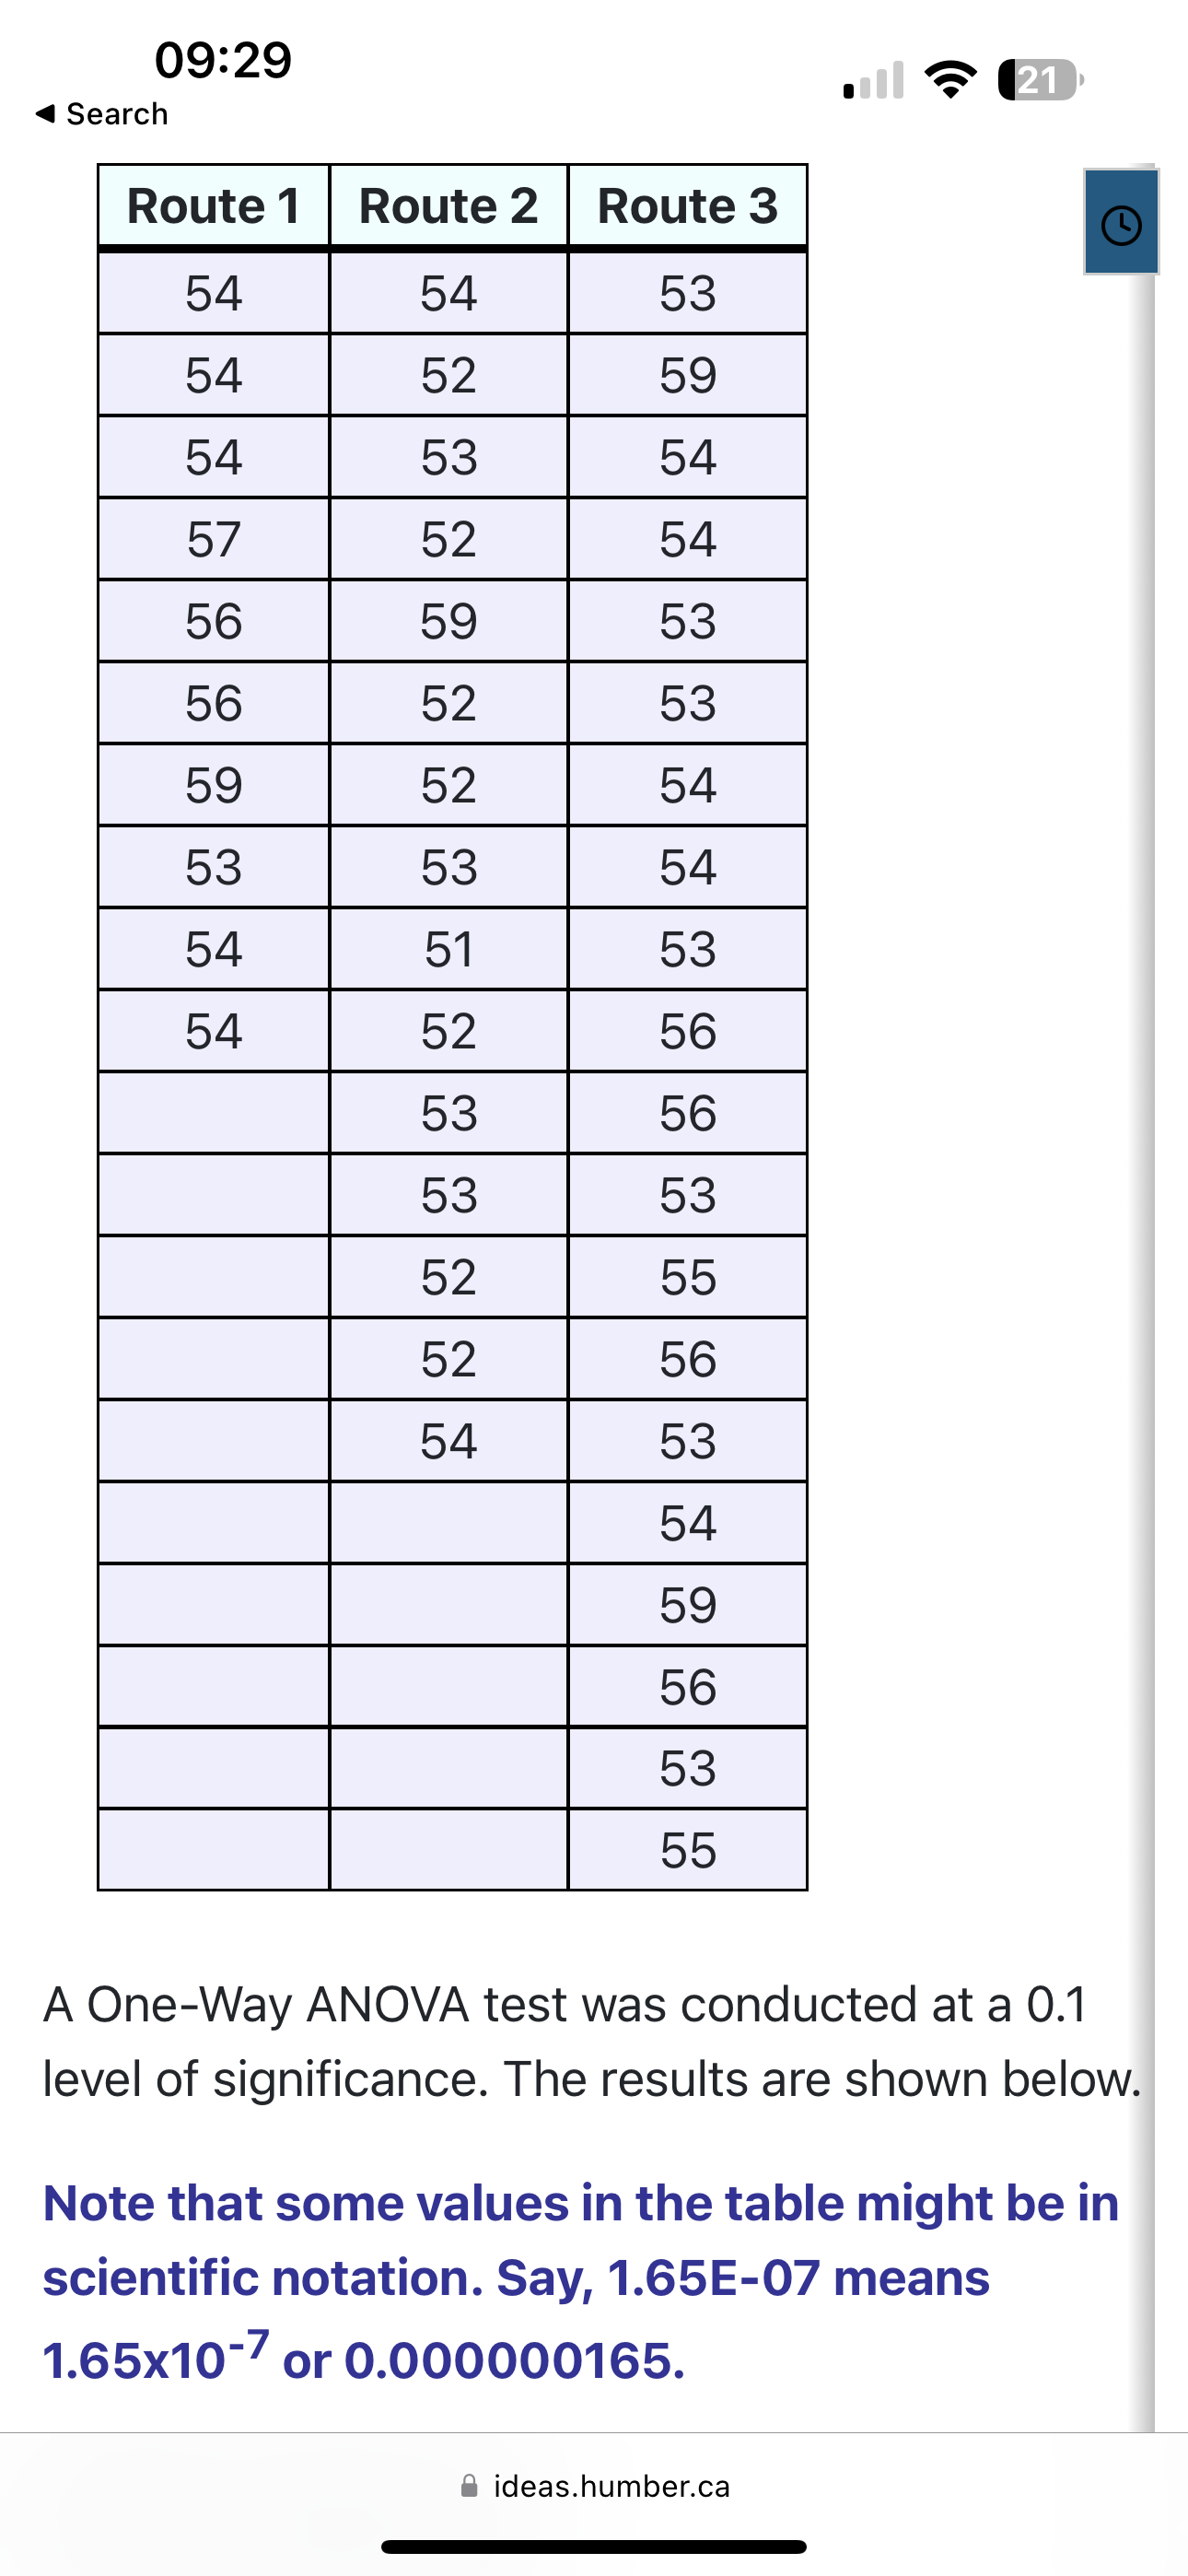
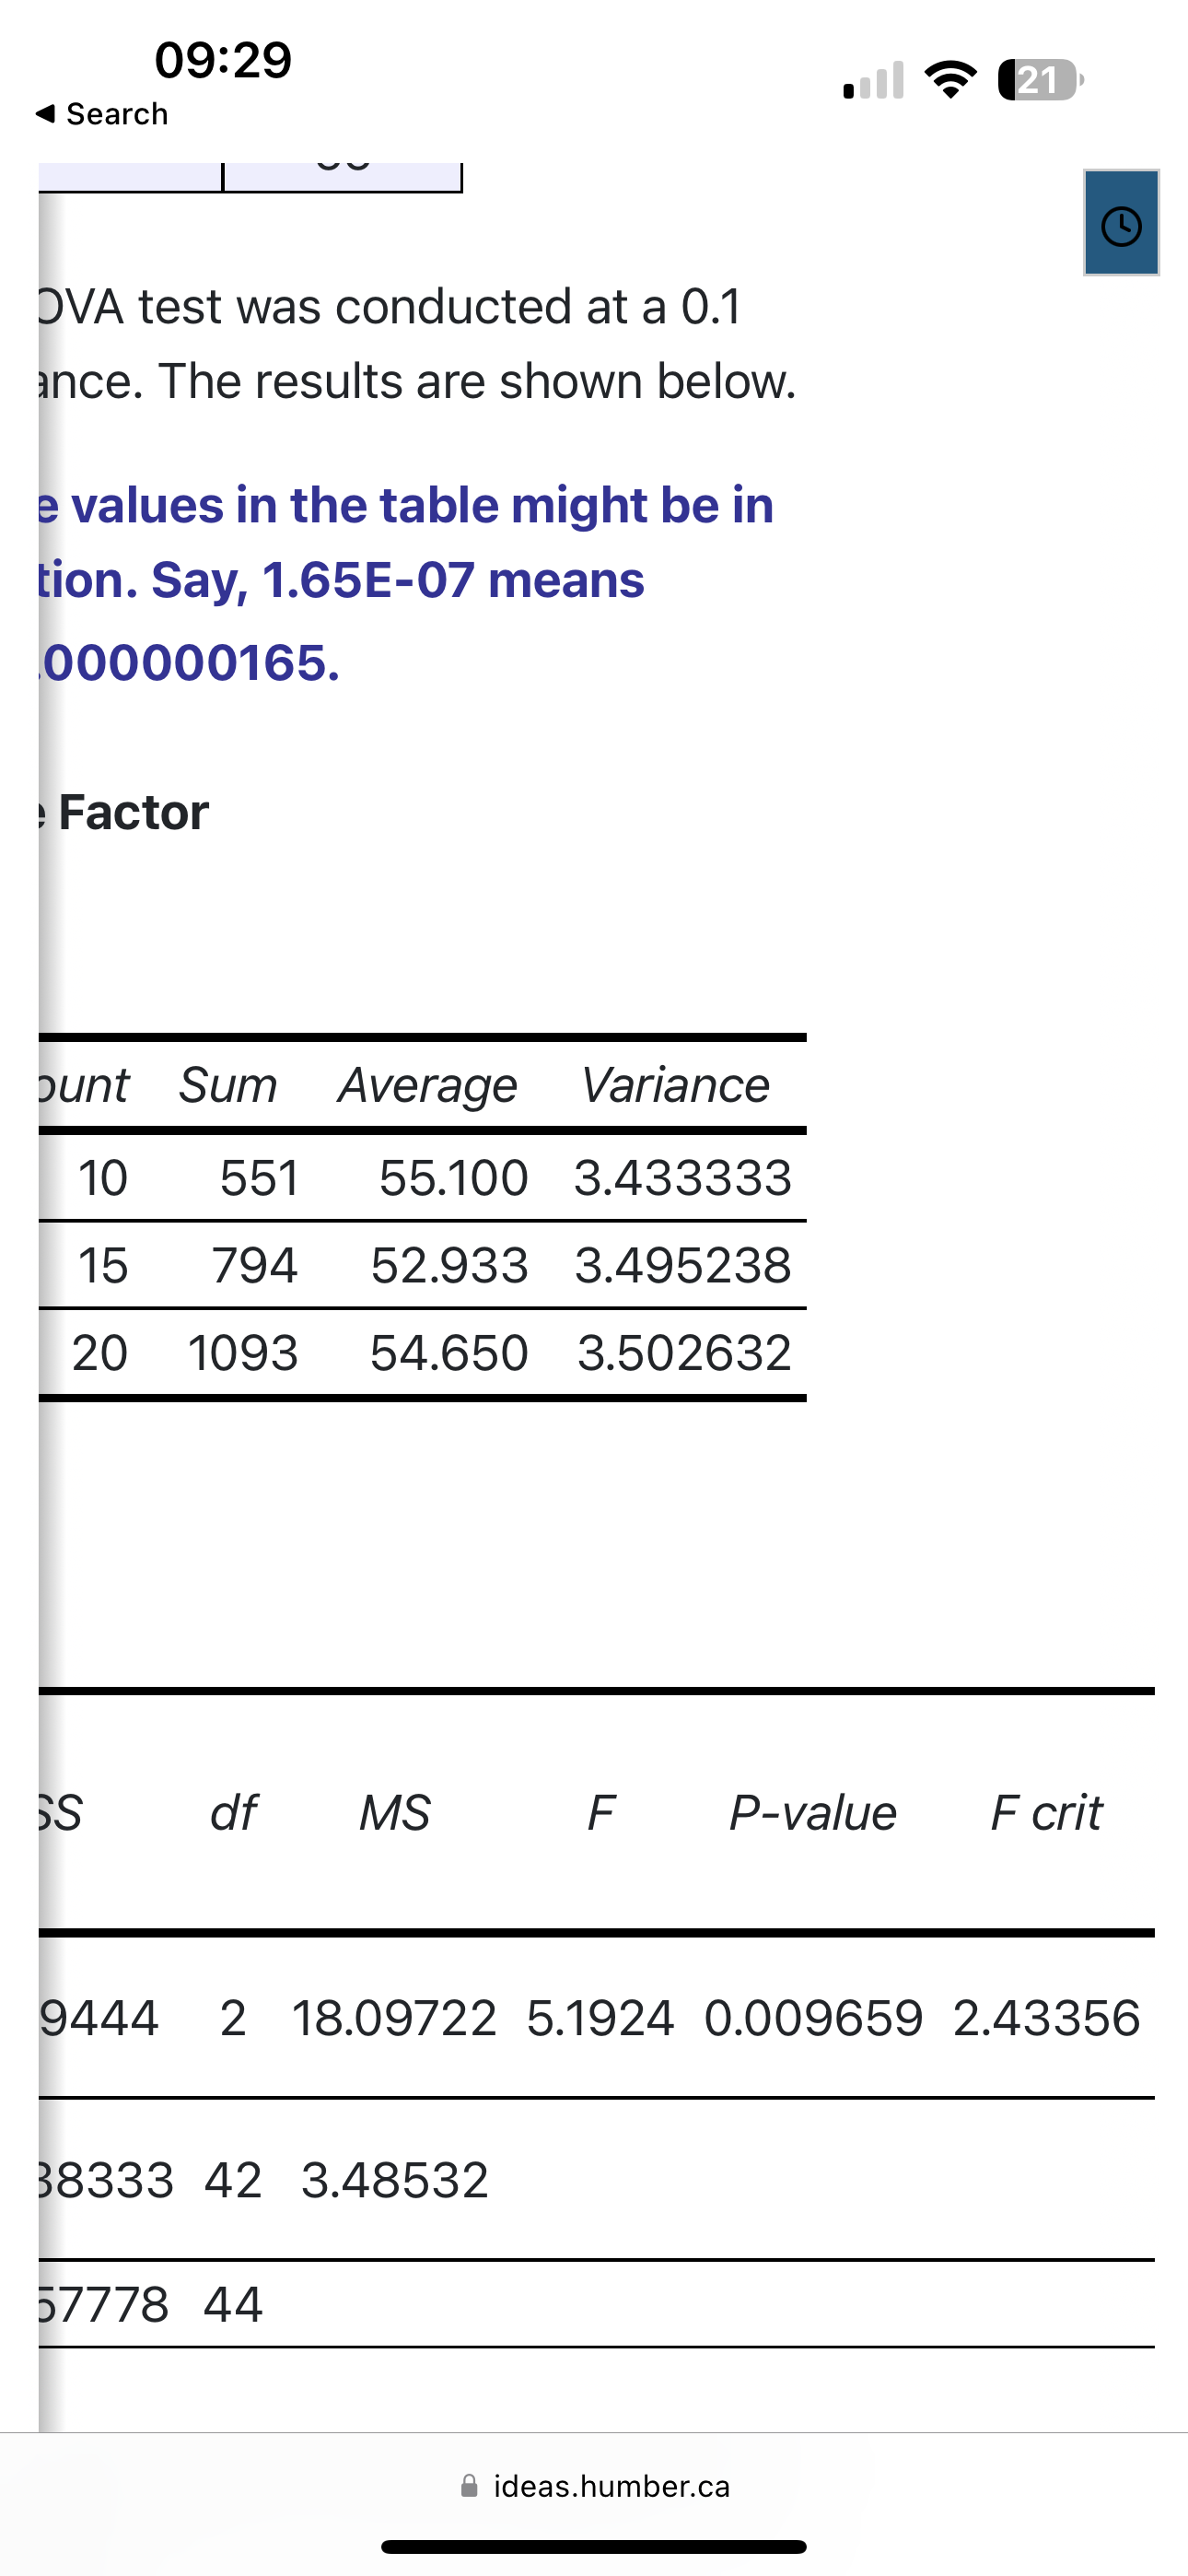
09329 A ' 1 Search Based on the Excel output, what conclusion is t' most appropriate? O At the 0.1 level of significance, the sample data support the claim that there is a difference in the average driving times. On average, the driving times on the major traffic routes are not the same. 0 For 0.1 level of significance the ANOVA test is unable to give a positive or a negative answer to the question whether different traffic routes affect the average driving times. The question needs futher investigation. 0 For 0.1 level of significance the ANOVA test shows the sample means and the sample variances, but fails to answer the question whether different traffic routes affect the average driving times. Probably, the researcher should increase the sample sizes. 0 At the 0.1 level of significance, there is not sufficient sample evidence to support the claim that there is a difference in the average driving times. On average, the driving times are approximately the same. O None of the above E ideas.humber.ca 09:29 21 Search A One-Way ANOVA test was conducted at a 0.1 level of significance. The results are shown below. Note that some values in the table might be in scientific notation. Say, 1.65E-07 means 1.65x10⁻⁷ or 0.000000165. ANOVA: Single Factor SUMMARY Groups Count Sum Average Variance Route 1 10 551 55.100 3.433333 Route 2 15 794 52.933 3.495238 Route 3 20 1093 54.650 3.502632 ANOVA Source of SS df MS F P-V Variation Between 36.19444 2 18.09722 5.1924 0.00 Groups Within 146.38333 42 3.48532 Groups Total 182.57778 44 ideas.humber.ca09:29 121 Search O Suppose a researcher is interested determining whether, on average, driving times on the major traffic routes are approximately the same or not. The following data are randomly collected from three major traffic routes. The entries in the table are driving times in minutes on the these routes. Route 1 Route 2 Route 3 54 54 53 54 52 59 54 53 54 57 52 54 56 59 53 56 52 53 59 52 54 53 53 54 54 51 53 54 52 56 53 56 53 53 52 55 52 56 54 53 54 59 56 53 ideas.humber.ca09:29 21 Search Route 1 Route 2 Route 3 54 54 53 54 52 59 54 53 54 57 52 54 56 59 53 56 52 53 59 52 54 53 53 54 54 51 53 54 52 56 53 56 53 53 52 55 52 56 54 53 54 59 56 53 55 A One-Way ANOVA test was conducted at a 0.1 level of significance. The results are shown below. Note that some values in the table might be in scientific notation. Say, 1.65E-07 means 1.65x10⁻⁷ or 0.000000165. ideas.humber.ca09:29 21 Search DVA test was conducted at a 0.1 ance. The results are shown below. e values in the table might be in tion. Say, 1.65E-07 means 000000165. Factor punt Sum Average Variance 10 551 55.100 3.433333 15 794 52.933 3.495238 20 1093 54.650 3.502632 SS df MS F P-value F crit 9444 2 18.09722 5.1924 0.009659 2.43356 38333 42 3.48532 57778 44 ideas.humber.ca
Step by Step Solution
There are 3 Steps involved in it

Get step-by-step solutions from verified subject matter experts