

Question: ( 1 0 Points ) Question 1 1 , Quantitative Methods for Business, Chapter 1 6 . a . ( PS 1 - 1 0
Points Question Quantitative Methods for Business, Chapter
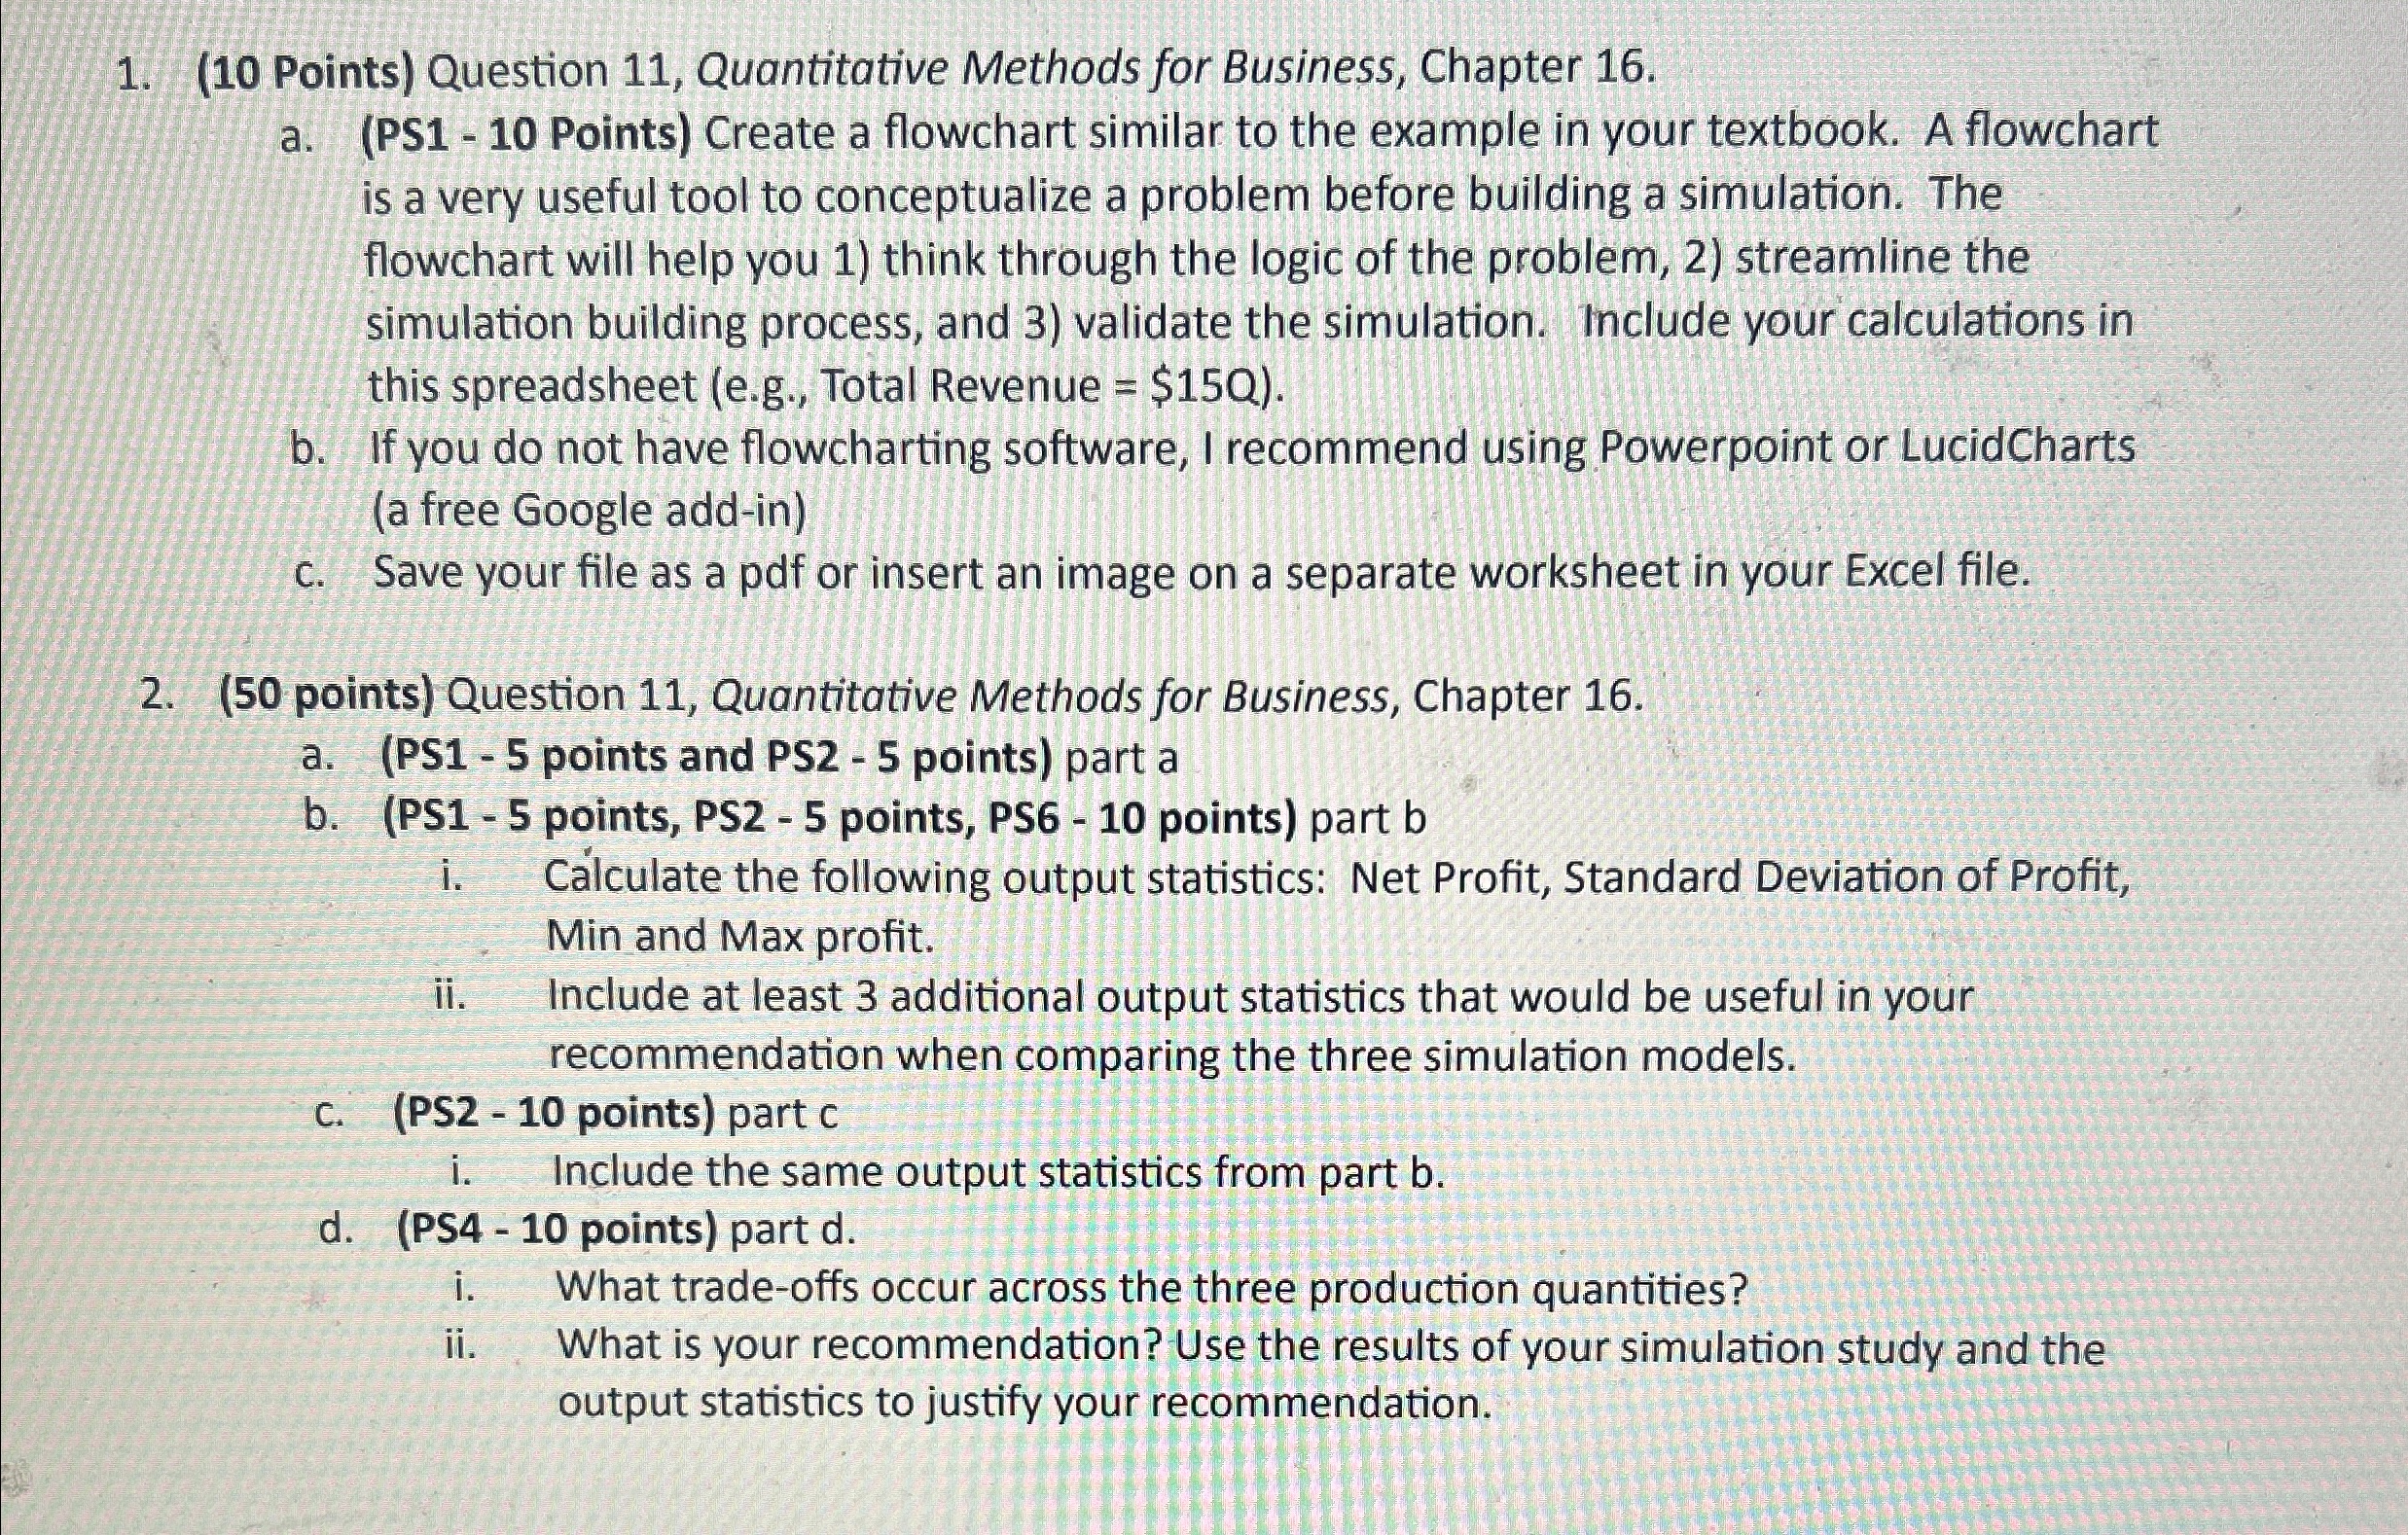
aPS Points Create a flowchart similar to the example in your textbook. A flowchart is a very useful tool to conceptualize a problem before building a simulation. The flowchart will help you think through the logic of the problem, streamline the simulation building process, and validate the simulation. Include your calculations in this spreadsheet eg Total Revenue $
b If you do not have flowcharting software, I recommend using Powerpoint or LucidCharts a free Google addin
c Save your file as a pdf or insert an image on a separate worksheet in your Excel file.
points Question Quantitative Methods for Business, Chapter
aPS points and PS points part a
bPS points, PS points, PS points part b
i Callculate the following output statistics: Net Profit, Standard Deviation of Profit, Min and Max profit.
ii Include at least additional output statistics that would be useful in your recommendation when comparing the three simulation models.
cPS points part c
i Include the same output statistics from part b
dPS points part d
i What tradeoffs occur across the three production quantities?
ii What is your recommendation? Use the results of your simulation study and the output statistics to justify your recommendation.
Step by Step Solution
There are 3 Steps involved in it
1 Expert Approved Answer
Step: 1 Unlock

Question Has Been Solved by an Expert!
Get step-by-step solutions from verified subject matter experts
Step: 2 Unlock
Step: 3 Unlock