

Question: 1 . ( 1 0 points ) An in - depth study of patterns of consumer behavior revealed that Jordan is indifferent between consuming the
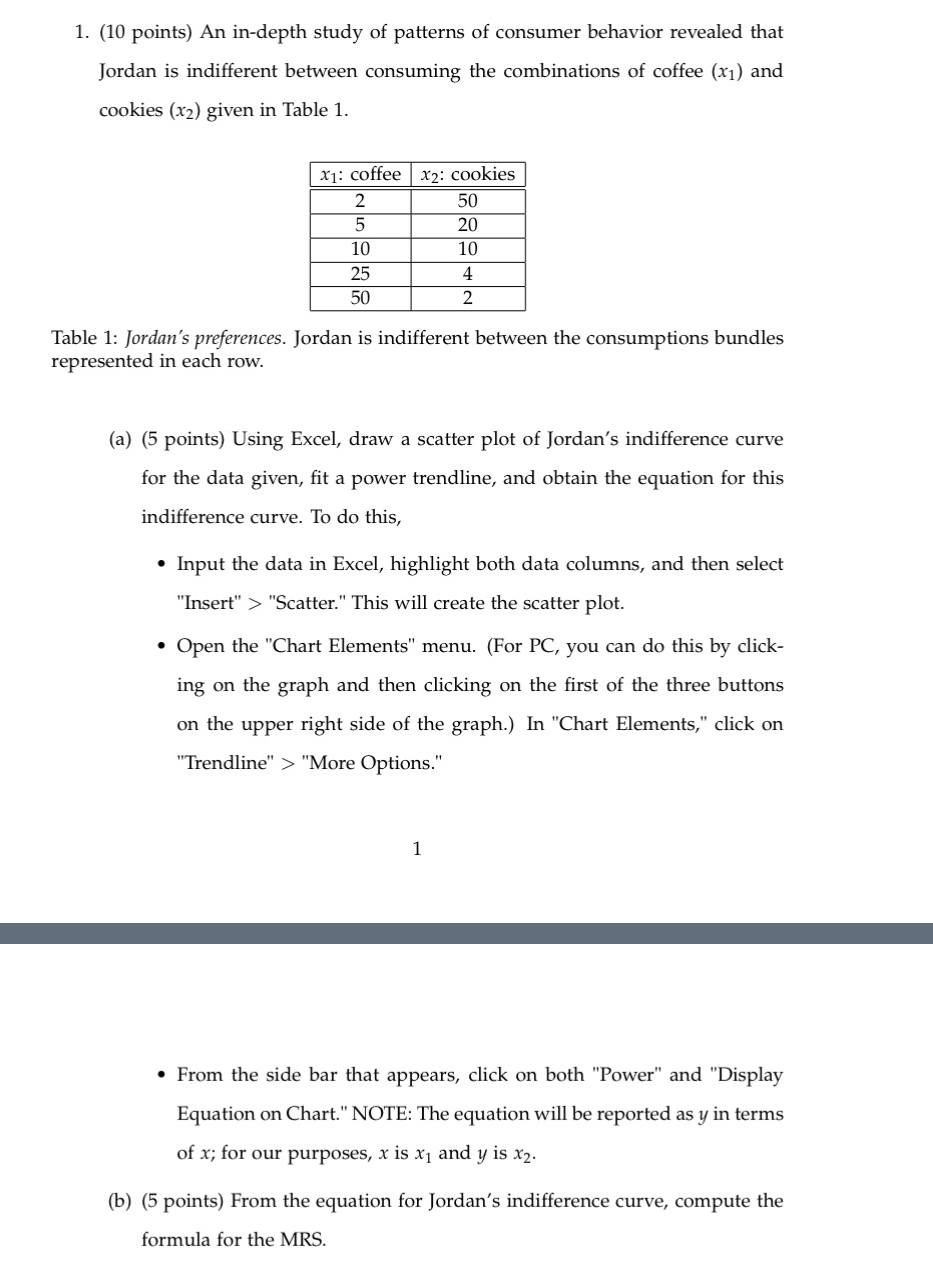
points An indepth study of patterns of consumer behavior revealed that Jordan is indifferent between consuming the combinations of coffee x and cookies leftxright given in Table
Table : Jordan's preferences. Jordan is indifferent between the consumptions bundles represented in each row.
a points Using Excel, draw a scatter plot of Jordan's indifference curve for the data given, fit a power trendline, and obtain the equation for this indifference curve. To do this,
Input the data in Excel, highlight both data columns, and then select "Insert" "Scatter." This will create the scatter plot.
Open the "Chart Elements" menu. For PC you can do this by clicking on the graph and then clicking on the first of the three buttons on the upper right side of the graph. In "Chart Elements," click on "Trendline" "More Options."
From the side bar that appears, click on both "Power" and "Display Equation on Chart." NOTE: The equation will be reported as y in terms of x ; for our purposes, x is x and y is x
b points From the equation for Jordan's indifference curve, compute the formula for the MRS
Step by Step Solution
There are 3 Steps involved in it
1 Expert Approved Answer
Step: 1 Unlock

Question Has Been Solved by an Expert!
Get step-by-step solutions from verified subject matter experts
Step: 2 Unlock
Step: 3 Unlock