

Question: 1 1 H(s) = A closed-loop control system is shown below, where G(s) = s +2s+2 S+1 positive or negative. Plot the Nyquist plot
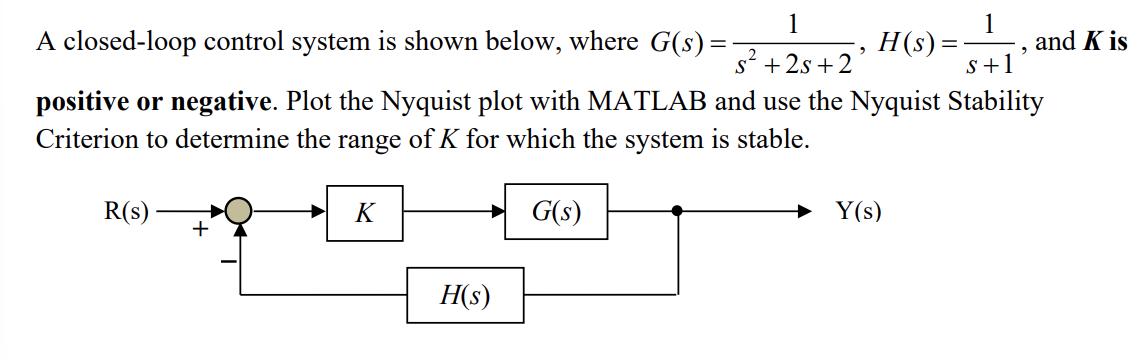
1 1 H(s) = A closed-loop control system is shown below, where G(s) = s +2s+2 S+1 positive or negative. Plot the Nyquist plot with MATLAB and use the Nyquist Stability Criterion to determine the range of K for which the system is stable. G(s) R(s) + K H(s) 2 Y(s) and Kis
Step by Step Solution
There are 3 Steps involved in it
1 Expert Approved Answer
Step: 1 Unlock

Question Has Been Solved by an Expert!
Get step-by-step solutions from verified subject matter experts
Step: 2 Unlock
Step: 3 Unlock