

Question: 1. (1 point) Looking at the side-by-side boxplot, are there any outliers? Discuss between what groups you would expect to see significant differences, and
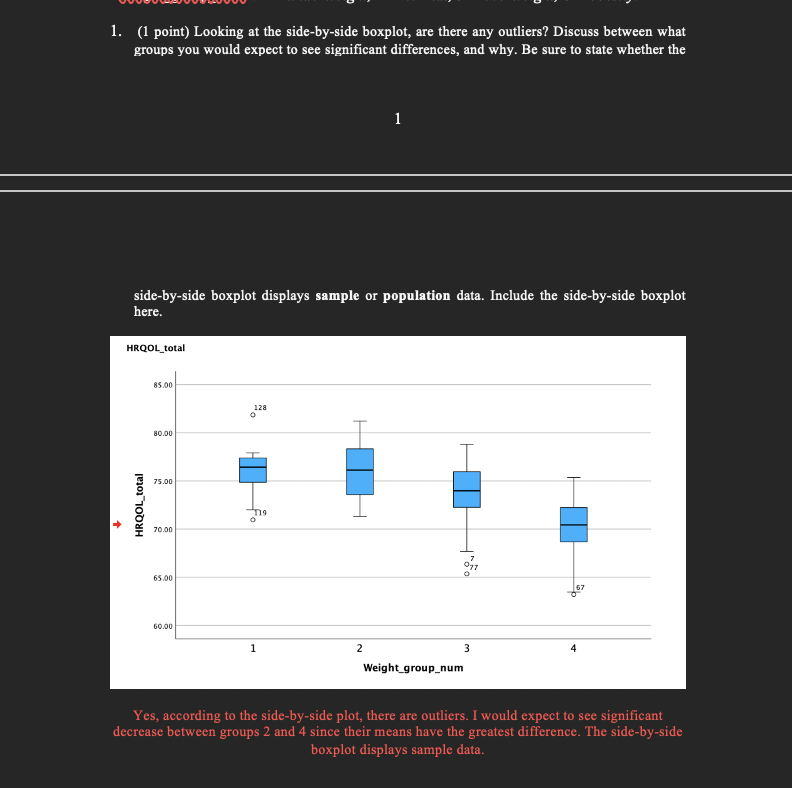
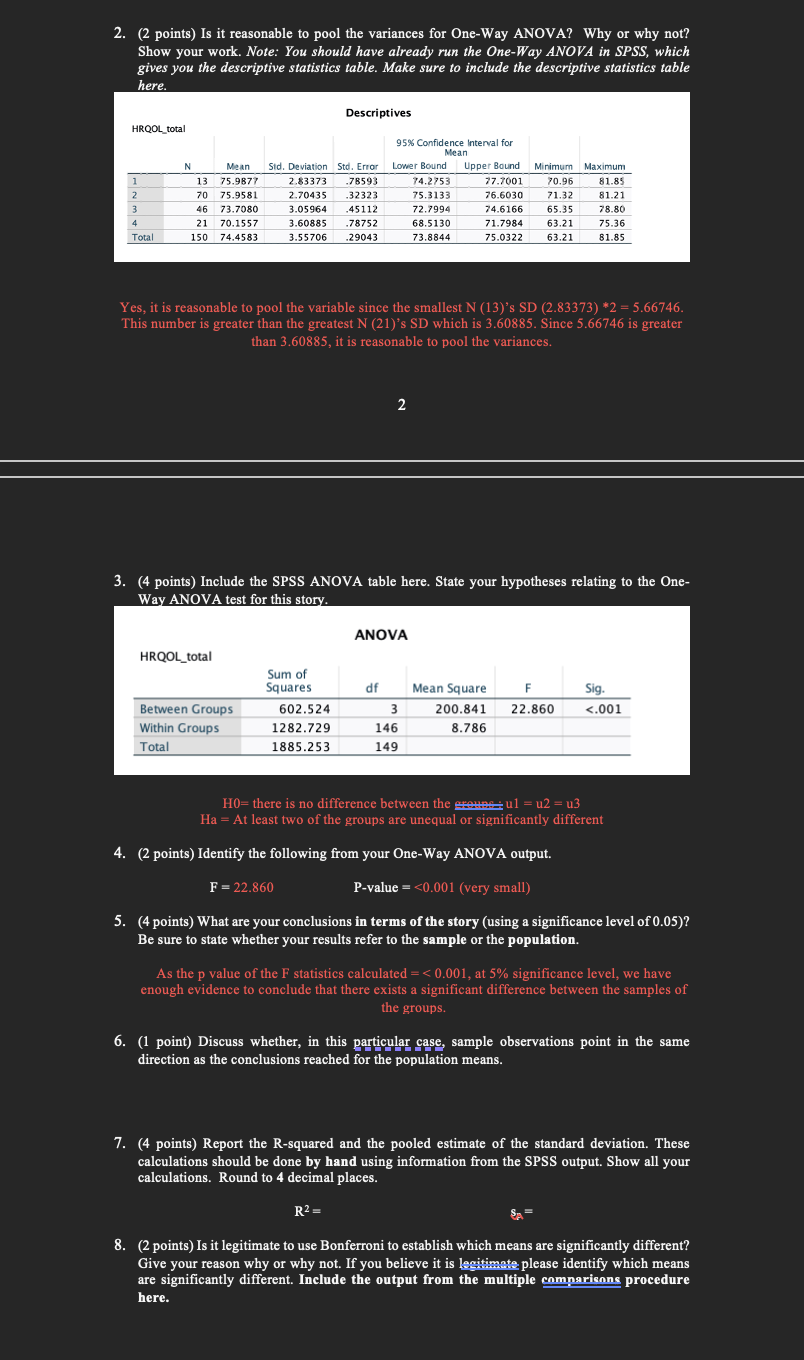
1. (1 point) Looking at the side-by-side boxplot, are there any outliers? Discuss between what groups you would expect to see significant differences, and why. Be sure to state whether the 1 side-by-side boxplot displays sample or population data. Include the side-by-side boxplot here. HRQOL_total + 85.00 HRQOL_total 80.00 75.00 70.00 65.00 128 Fo 60.00 1 2 3 4 Weight_group_num Yes, according to the side-by-side plot, there are outliers. I would expect to see significant decrease between groups 2 and 4 since their means have the greatest difference. The side-by-side boxplot displays sample data. 2. (2 points) Is it reasonable to pool the variances for One-Way ANOVA? Why or why not? Show your work. Note: You should have already run the One-Way ANOVA in SPSS, which gives you the descriptive statistics table. Make sure to include the descriptive statistics table here. Descriptives HRQOL_total 95% Confidence Interval for Mean N 1 2 Mean 13 75.9877 70 75.9581 Std. Deviation Std. Error Lower Bound Upper Bound Minimum Maximum 2.83373 .78593 74.2753 77.7001 70.96 81.85 2.70435 .32323 75.3133 76.6030 71.32 81.21 3 4 46 Total 73.7080 21 70.1557 150 74.4583 3.05964 .45112 72.7994 74.6166 65.35 78.80 3.60885 .78752 3.55706 .29043 68.5130 73.8844 71.7984 75.0322 63.21 75.36 63.21 81.85 Yes, it is reasonable to pool the variable since the smallest N (13)'s SD (2.83373) *2 = 5.66746. This number is greater than the greatest N (21)'s SD which is 3.60885. Since 5.66746 is greater than 3.60885, it is reasonable to pool the variances. 2 3. (4 points) Include the SPSS ANOVA table here. State your hypotheses relating to the One- Way ANOVA test for this story. HRQOL_total Between Groups Within Groups Total ANOVA Sum of Squares df Mean Square F Sig. 602.524 1282.729 1885.253 3 146 149 200.841 8.786 22.860
Step by Step Solution
There are 3 Steps involved in it
1Outliners yes there are outliners outliers are marked by individual points outside the whiske... View full answer

Get step-by-step solutions from verified subject matter experts