

Question: 1 1 : The quality tool that plots the number of quality problems over time is: Select the correct response: Pareto diagram Run chart. Cause
: The quality tool that plots the number of quality problems over time is:
Select the correct response:
Pareto diagram
Run chart.
Causeandeffect diagram
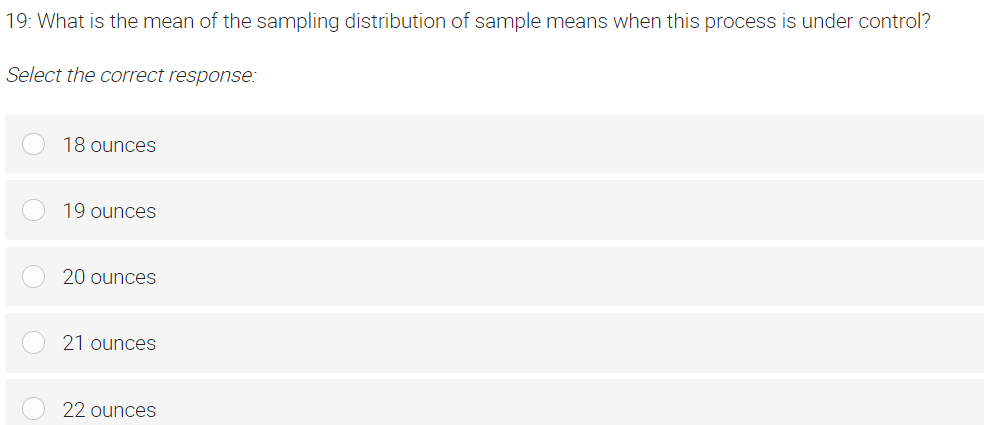
Fishbone diagram.What is the mean of the sampling distribution of sample means when this process is under control?
Select the correct response:
ounces
ounces
ounces
ounces
ounces
Step by Step Solution
There are 3 Steps involved in it
1 Expert Approved Answer
Step: 1 Unlock

Question Has Been Solved by an Expert!
Get step-by-step solutions from verified subject matter experts
Step: 2 Unlock
Step: 3 Unlock