

Question: 1 .(10 points) Assign each data type with the scale of measurement. (E.g. nominal, ordinal, interval, ratio) 2 .(10 points) Build a frequency distribution for
1.(10 points) Assign each data type with the scale of measurement. (E.g. nominal, ordinal, interval, ratio)
2.(10 points) Build a frequency distribution for scale of measurements and plot the results using the Bar Chart (format the chart in the meaningful way). 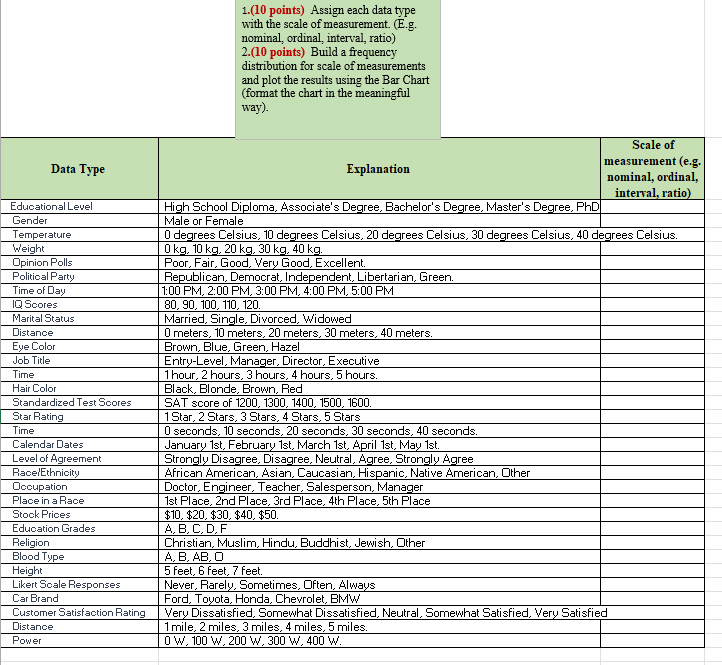
1.(10 points) Assign each data type with the scale of measurement. (E.g. nominal, ordinal, interval, ratio) 2.(10 points) Build a frequency distribution for scale of measurements and plot the results using the Bar Chart (format the chart in the meaningful way)
Step by Step Solution
There are 3 Steps involved in it
1 Expert Approved Answer
Step: 1 Unlock

Question Has Been Solved by an Expert!
Get step-by-step solutions from verified subject matter experts
Step: 2 Unlock
Step: 3 Unlock