

Question: 1) (10 points) Forecasting: The monthly data for about 160 StoneAge parts (StoneAge Wathrblast Tools) over a threeyear period are available online. Why don't we
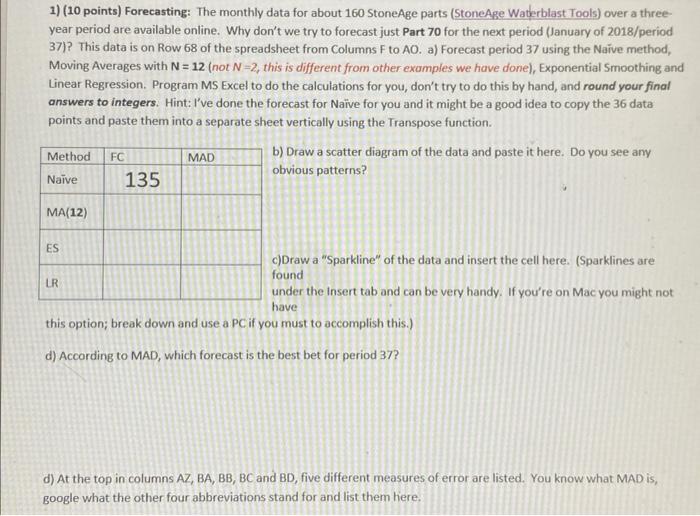
1) (10 points) Forecasting: The monthly data for about 160 StoneAge parts (StoneAge Wathrblast Tools) over a threeyear period are available online. Why don't we try to forecast just Part 70 for the next period (January of 2018/period 37)? This data is on Row 68 of the spreadsheet from Columns F to AO. a) Forecast period 37 using the Naive method, Moving Averages with N=12 (not N=2, this is different from other examples we have done), Exponential Smoothing and Linear Regression. Program MS Excel to do the calculations for you, don't try to do this by hand, and round your final answers to integers. Hint: I've done the forecast for Naive for you and it might be a good idea to copy the 36 data points and paste them into a separate sheet vertically using the Transpose function. b) Draw a scatter diagram of the data and paste it here. Do you see any obvious patterns? c)Draw a "Sparkline" of the data and insert the cell here. (Sparklines are found under the Insert tab and can be very handy. If you're on Mac you might not have this option; break down and use a PC if you must to accomplish this.) d) According to MAD, which forecast is the best bet for period 37 ? d) At the top in columns AZ, BA, BB, BC and BD, five different measures of error are listed. You know what MAD is, google what the other four abbreviations stand for and list them here
Step by Step Solution
There are 3 Steps involved in it

Get step-by-step solutions from verified subject matter experts