

Question: (1) (10 pts) Consider the accumulation function F(x) = / g(t) dt on the interval [-4, 6]. The graph of the integrand g(t) is given
![dt on the interval [-4, 6]. The graph of the integrand g(t)](https://s3.amazonaws.com/si.experts.images/answers/2024/06/667b79d59245e_149667b79d568680.jpg)
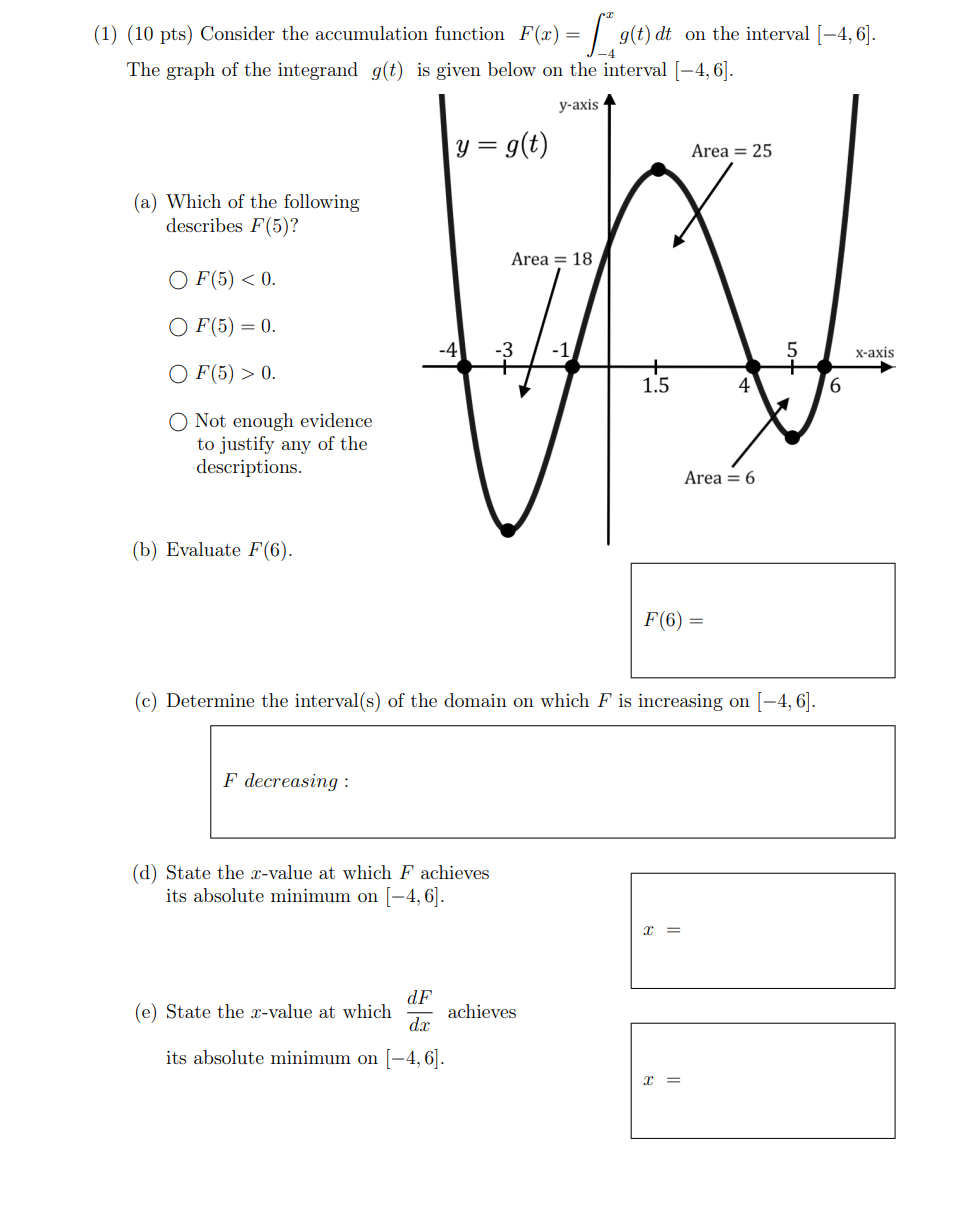
(1) (10 pts) Consider the accumulation function F(x) = / g(t) dt on the interval [-4, 6]. The graph of the integrand g(t) is given below on the interval [-4, 6]. y-axis y = g(t) Area = 25 (a) Which of the following describes F(5)? Area = 18 OF(5) 0. 1.5 O Not enough evidence to justify any of the descriptions. Area = 6 (b) Evaluate F(6). F(6) = (c) Determine the interval(s) of the domain on which F is increasing on [-4, 6]. F decreasing : (d) State the r-value at which F achieves its absolute minimum on [-4, 6]. D = (e) State the r-value at which dF dx achieves its absolute minimum on [-4, 6]. T =
Step by Step Solution
There are 3 Steps involved in it
1 Expert Approved Answer
Step: 1 Unlock

Question Has Been Solved by an Expert!
Get step-by-step solutions from verified subject matter experts
Step: 2 Unlock
Step: 3 Unlock