

Question: 1. (11 points) The table below presents the returns on stocks ABC and XYZ for a five-year period. Year 1 2 3 4 5 ABC
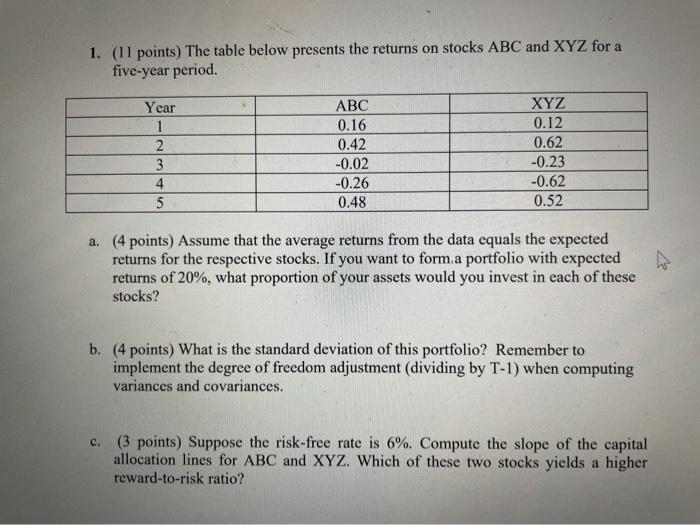
1. (11 points) The table below presents the returns on stocks ABC and XYZ for a five-year period. Year 1 2 3 4 5 ABC 0.16 0.42 -0.02 -0.26 0.48 XYZ 0.12 0.62 -0.23 -0.62 0.52 a. (4 points) Assume that the average returns from the data equals the expected returns for the respective stocks. If you want to form a portfolio with expected returns of 20%, what proportion of your assets would you invest in each of these stocks? b. (4 points) What is the standard deviation of this portfolio? Remember to implement the degree of freedom adjustment (dividing by T-1) when computing variances and covariances. c. (3 points) Suppose the risk-free rate is 6%. Compute the slope of the capital allocation lines for ABC and XYZ. Which of these two stocks yields a higher reward-to-risk ratio
Step by Step Solution
There are 3 Steps involved in it

Get step-by-step solutions from verified subject matter experts