

Question: 1. (15 Points) Finding and plotting residuals. Consider the data on x and y shown in the table. The data is also available in the
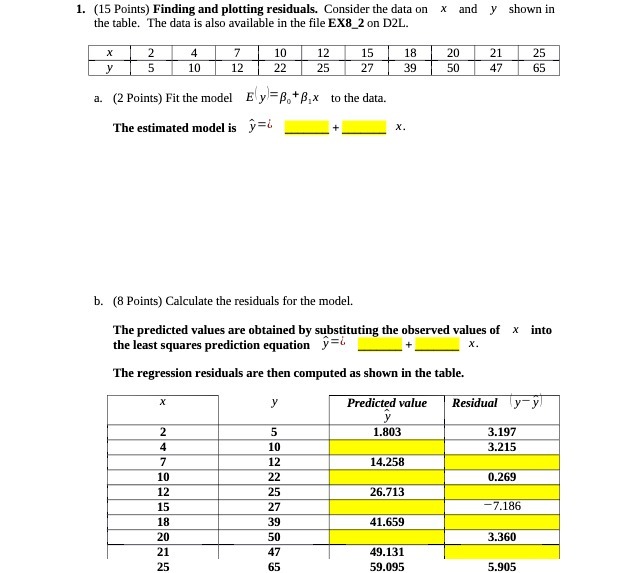
1. (15 Points) Finding and plotting residuals. Consider the data on x and y shown in the table. The data is also available in the file EX8_2 on D2L. X 2 4 7 10 12 15 18 20 21 25 y 5 10 12 22 25 27 39 50 47 65 a. (2 Points) Fit the model Ey =8,+8, x to the data. The estimated model is y= X. b. (8 Points) Calculate the residuals for the model. The predicted values are obtained by substituting the observed values of x into the least squares prediction equation = X. The regression residuals are then computed as shown in the table. X y Predicted value Residual \\y y y 5 1.803 3.197 4 10 3.215 7 12 14.258 10 22 0.269 12 25 26.713 27 -7.186 18 39 41.659 20 50 3.360 21 47 49.131 25 65 59.095 5.905
Step by Step Solution
There are 3 Steps involved in it

Get step-by-step solutions from verified subject matter experts