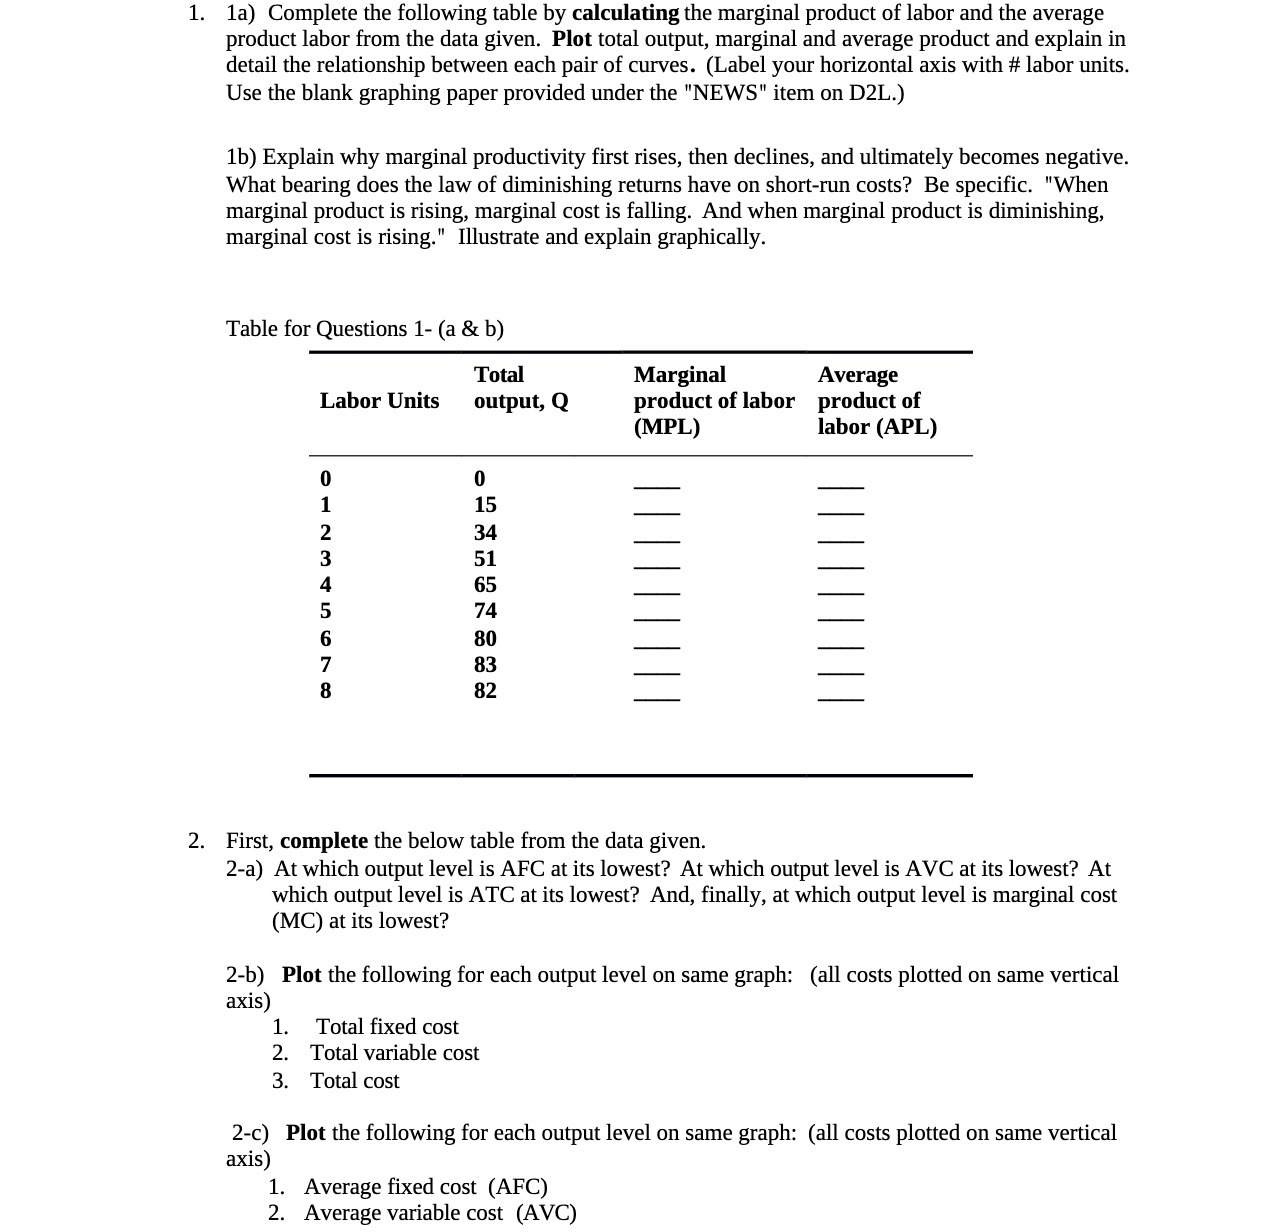
Question: 1. 1a) Complete the following table by calculating the marginal product of labor and the average product labor from the data given. Plot total output,

1. 1a) Complete the following table by
1. 1a) Complete the following table by calculating the marginal product of labor and the average product labor from the data given. Plot total output, marginal and average product and explain in detail the relationship between each pair of curves. (Label your horizontal axis with # labor units. Use the blank graphing paper provided under the "NEWS" item on D2L.) 1b) Explain why marginal productivity first rises, then declines, and ultimately becomes negative. What bearing does the law of diminishing returns have on short-run costs? Be specic. "When marginal product is rising, marginal cost is falling. And when marginal product is diminishing, marginal cost is rising." Illustrate and explain graphically. Table for Questions 1- (a 8: b) Total Marginal Average Labor Units output, Q product of labor product of (MPL) labor (APL) 15 51 65 74 80 83 B2 mthNI-l: lllllllll lllllllll 2. First, complete the below table from the data given. 2-a) At which output level is AFC at its lowest? At which output level is AVC at its lowest? At which output level is ATC at its lowest? And, finally, at which output level is marginal cost (MC) at its lowest? 2-b) Plot the following for each output level on same graph: (all costs plotted on same vertical axis) 1. Total xed cost 2. Total variable cost 3. Total cost 2-c) Plot the following for each output level on same graph: (all costs plotted on same vertical axis) 1. Average xed cost (AFC) 2. Average variable cost (AVG)

Step by Step Solution

There are 3 Steps involved in it

1 Expert Approved Answer
Step: 1 Unlock blur-text-image
Question Has Been Solved by an Expert!

Get step-by-step solutions from verified subject matter experts

Step: 2 Unlock
Step: 3 Unlock

Students Have Also Explored These Related Accounting Questions!