

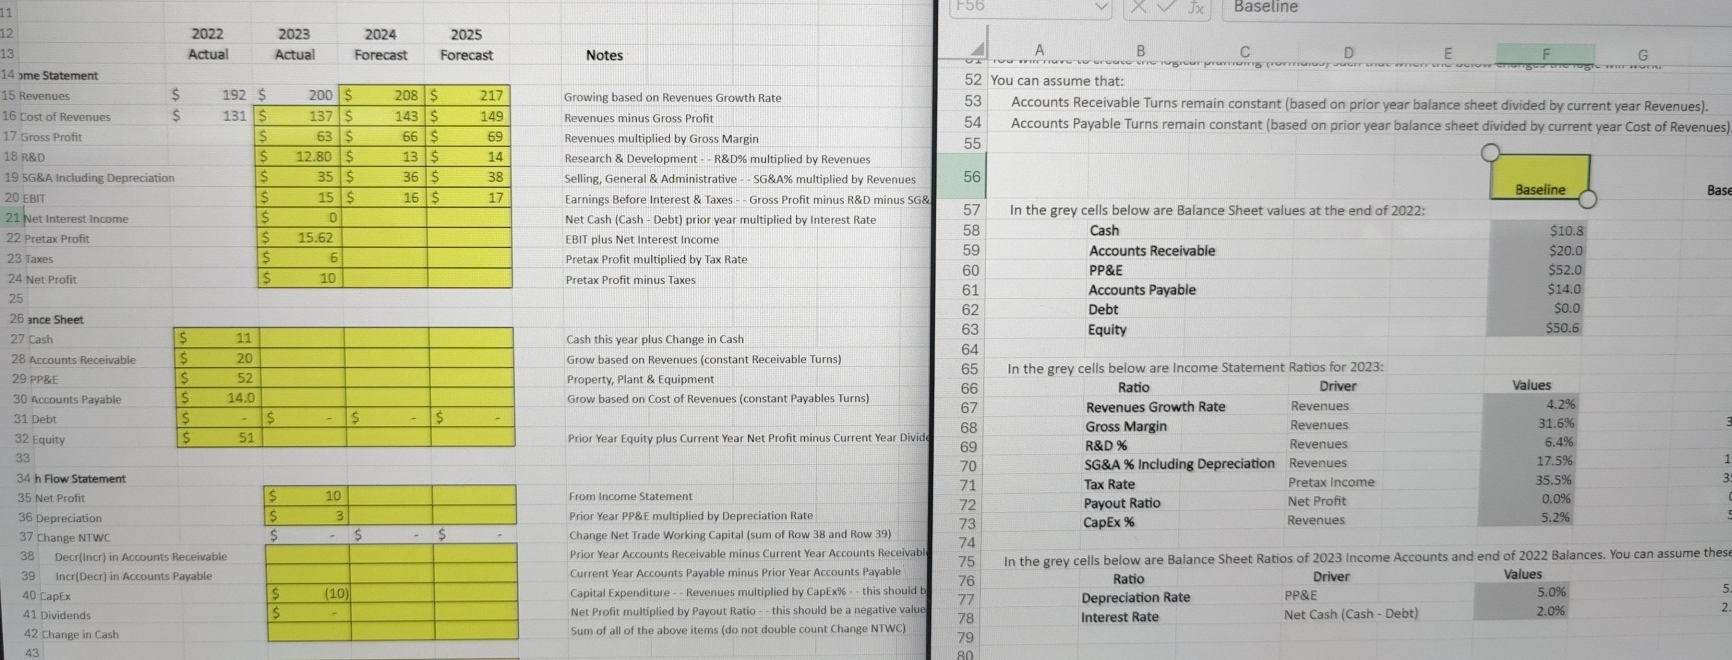
Question: 1 2 1 3 1 4 me Statement 1 5 Revenues 1 6 Cost of Revenues 1 7 Gross Profit 1 8 R&D 1 9
me Statement Revenues Cost of Revenues Gross Profit R&DG&A Including Depreciation EBIT Net Interest Income Pretax Profit Taxes Net Profit ance Sheet Cash Accounts Receivable PP&E Accounts Payable Debt Equity h Flow Statement Net Profit Depreciation Change NTWC CapEx Decrincr in Accounts ReceivableincrDecr in Accounts Payable DividendsActual Change in Cash S SSActual S S SSForecastS$$$$ $SForecastNotesGrowing based on Revenues Growth RateRevenues minus Gross ProfitRevenues multiplied by Gross MarginResearch & DevelopmentR&D multiplied by RevenuesSelling, General & AdministrativeEarnings Before Interest & TaxesNet Cash Cash Debt prior yearEBIT plus Net Interest IncomePretax Profit multiplied by Tax RatePretax Profit minus TaxesSG&A multiplied by RevenuesGross Profit minus R&D minus SG&multiplied by interest RateCash this year plus Change in CashGrow based on Revenues constant Receivable TurnsProperty Plant & EquipmentGrow based on Cost of Revenues constant Payables TurnsPrior Year Equity plus Current Year Net Profit minus Current Year DivideFrom Income StatementPrior Year PP&E multiplied by Depreciation RateChange Net Trade Working Capital sum of Row and Row Prior Year Accounts Receivable minus Current Year Accounts ReceivablCurrent Year Accounts Payable minus Prior Year Accounts PayableCapital Expenditure Revenues multiplied by Caplx this should bve valueNet Profit multiplied by Payout Ratio this should be a negativeSum of all of the above items do not double count Change NTWCF You can assume that:PP&EBIn the grey cells below are Balance Sheet values at the end of :CashAccounts ReceivableEquityAccounts Receivable Turns remain constant based on prior year balance sheet divided by current year RevenuesAccounts Payable Turns remain constant based on prior year balance sheet divided by current year Cost of RevenuesAccounts PayableDebtJx BaselinewgycurGross MarginR&D In the grey cells below are Income Statement Ratios for :RatioRevenues Growth RateTax RatePayout RatioCapEx DSG&A Including Depreciation RevenuesRatioDepreciation RateInterest RateDriverRevenuesRevenuesRevenuesPretax IncomeNet ProfitRevenuesDriverPP&EENet Cash Cash DebtFBaseline$$$$ValuesValues$$In the grey cells below are Balance Sheet Ratios of Income Accounts and end of Balances. You can assume theseGBase
Step by Step Solution
There are 3 Steps involved in it
1 Expert Approved Answer
Step: 1 Unlock

Question Has Been Solved by an Expert!
Get step-by-step solutions from verified subject matter experts
Step: 2 Unlock
Step: 3 Unlock