

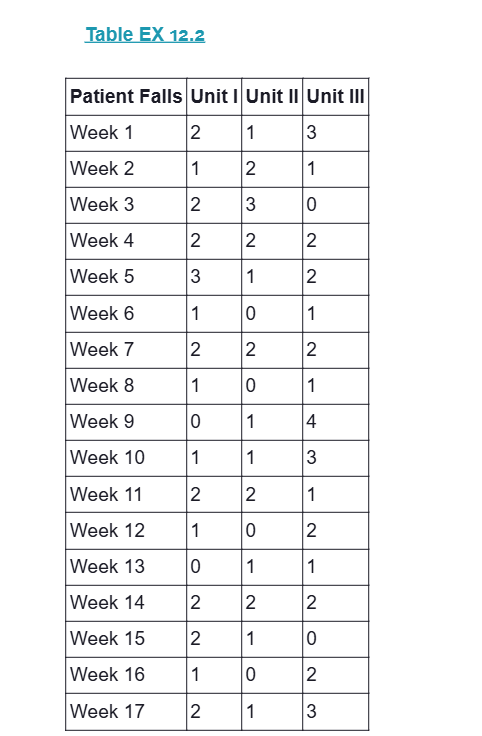
Question: 1 2 . 2 The data in Table EX 1 2 . 2 records the patient falls in three care units over a seventeen -
The data in Table EX records the patient falls in three care units over a seventeenweek period.
A For each unit, calculate LCL and UCL for an appropriate control chart, using percent confidence limits
B Construct a control chart for each unit.
C Are any observations in violation of the control limits for the unit?
Step by Step Solution
There are 3 Steps involved in it
1 Expert Approved Answer
Step: 1 Unlock

Question Has Been Solved by an Expert!
Get step-by-step solutions from verified subject matter experts
Step: 2 Unlock
Step: 3 Unlock