

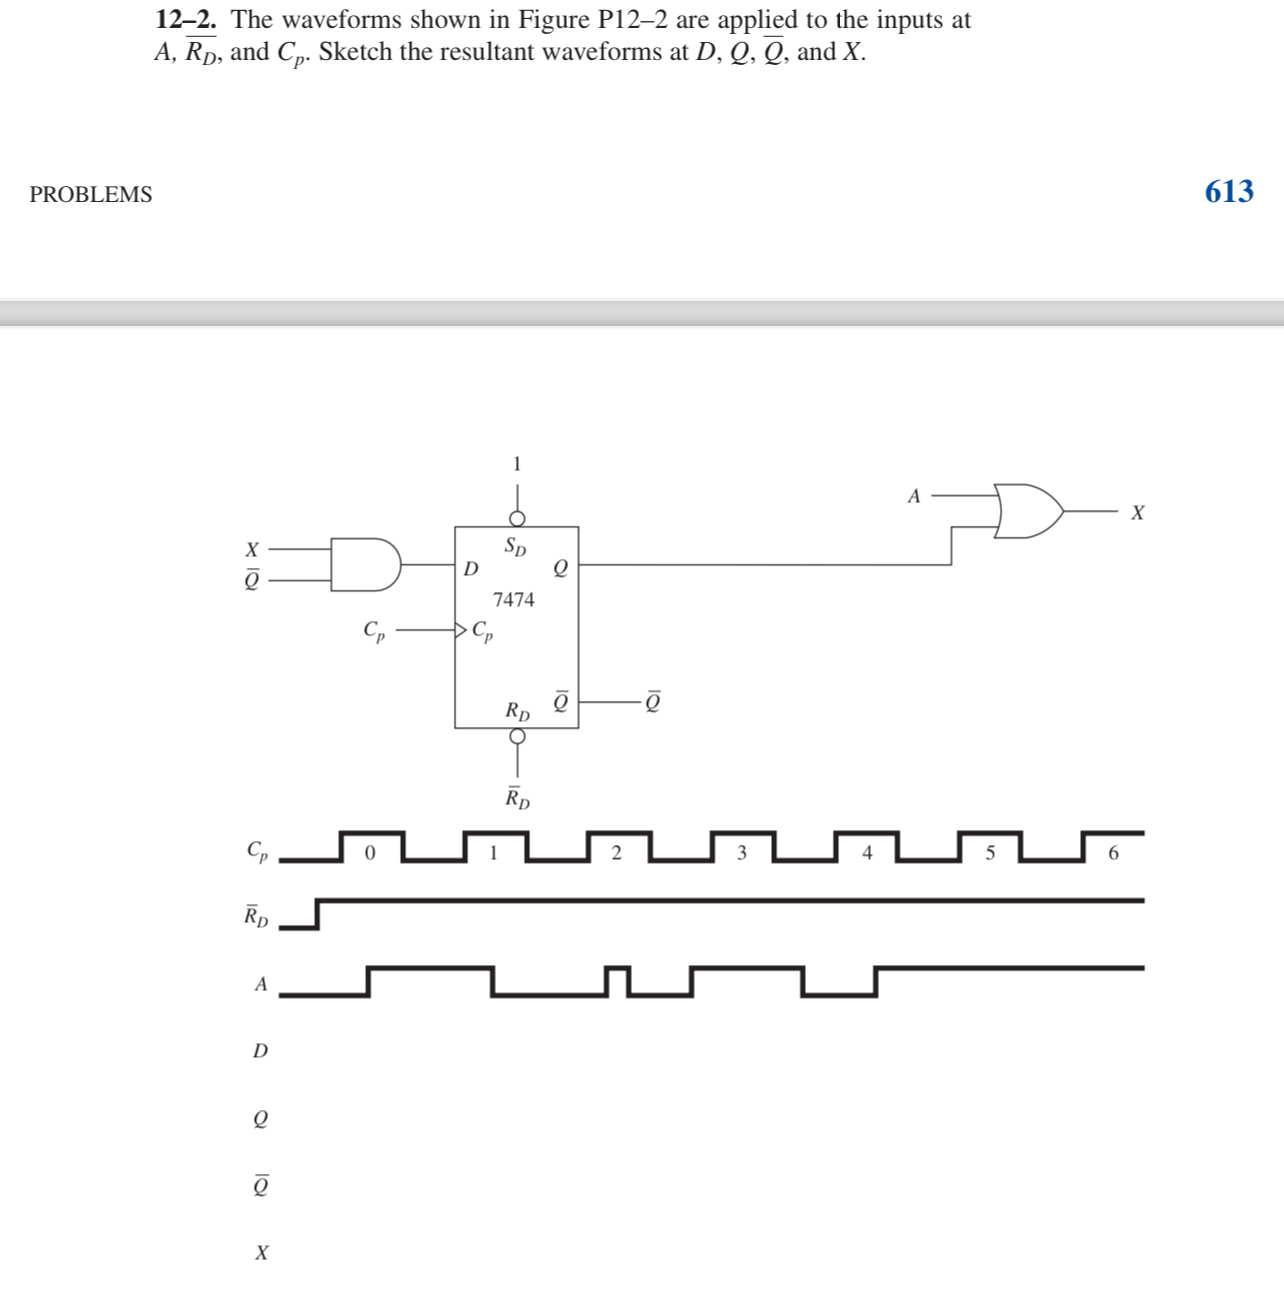
Question: 1 2 - 2 . The waveforms shown in Figure P 1 2 - 2 are applied to the inputs at A , b a
The waveforms shown in Figure P are applied to the inputs at and Sketch the resultant waveforms at and
Step by Step Solution
There are 3 Steps involved in it
1 Expert Approved Answer
Step: 1 Unlock

Question Has Been Solved by an Expert!
Get step-by-step solutions from verified subject matter experts
Step: 2 Unlock
Step: 3 Unlock