

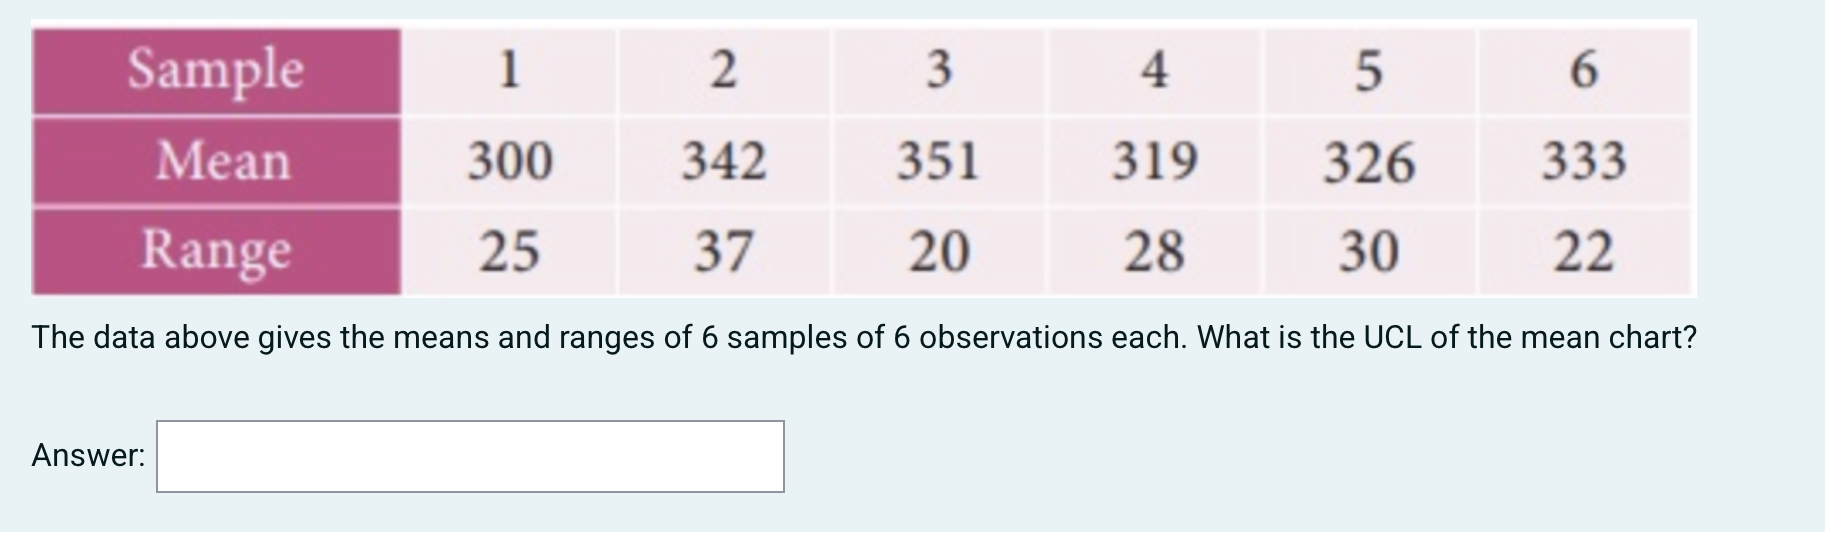
Question: 1 2 3 4 5 6 Sample Mean Range 300 342 351 319 326 333 25 37 20 28 30 22 The data above gives
Step by Step Solution
There are 3 Steps involved in it
1 Expert Approved Answer
Step: 1 Unlock

Question Has Been Solved by an Expert!
Get step-by-step solutions from verified subject matter experts
Step: 2 Unlock
Step: 3 Unlock