

Question: 1) 2) 3) 4) Standard Deviation 22 Mod Median 222 222 Elements of the series Arithmetic Average Geo. Ave. Mean Deviation 0 ??? ??? ???
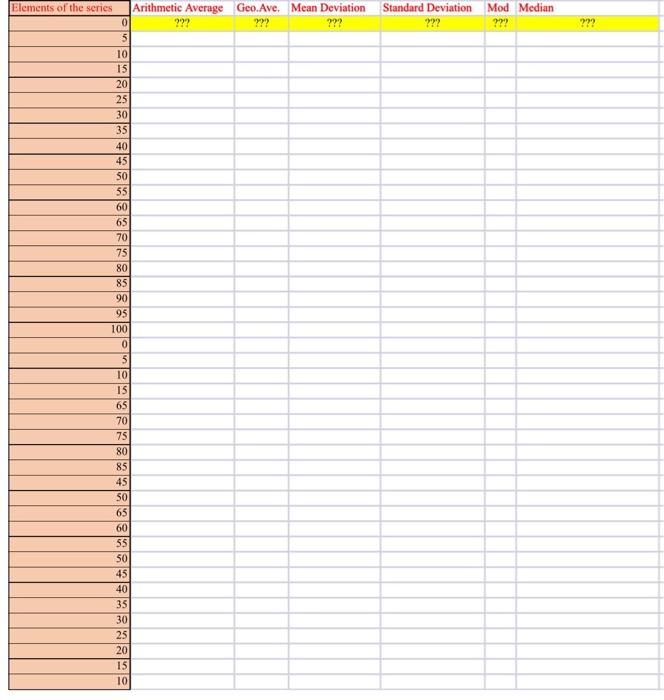
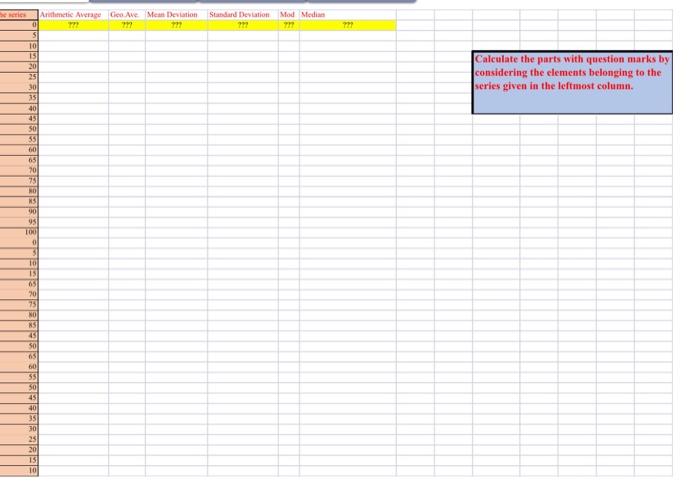
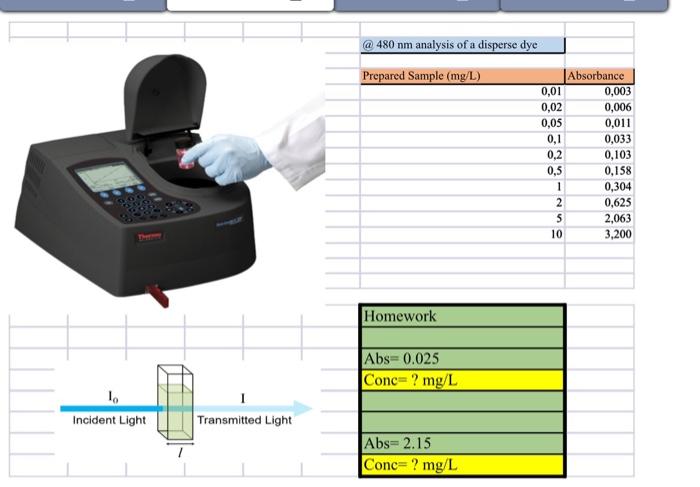
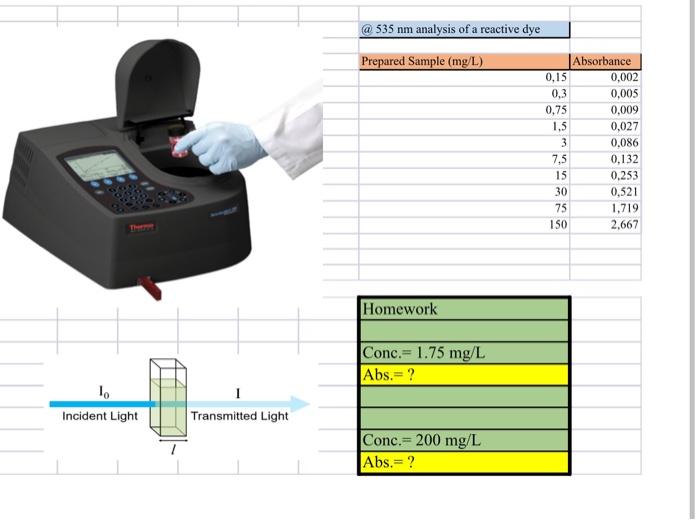
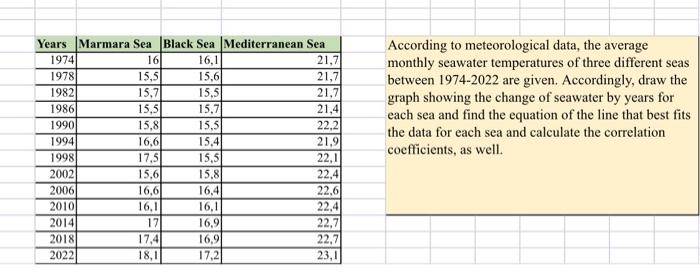
Standard Deviation 22 Mod Median 222 222 Elements of the series Arithmetic Average Geo. Ave. Mean Deviation 0 ??? ??? ??? 5 10 15 20 25 30 35 40 45 50 55 60 65 70 75 80 85 90 95 100 0 5 10 15 65 70 75 80 851 45 65 60 55 50 45 40 35 30 25 20 15 10 BESUS 8 & S 791 Calculate the parts with question marks by considering the elements belonging to the series given in the leftmost column. Arithmetic Average Geo. Are Mean Deviation Standard Deviation Mod Media 0 77 71 717 77 $ 10 15 20 25 30 35 40 45 50 55 60 65 70 75 NO NS 00 95 100 0 TO 19 65 20 75 NO NS 35 50 65 60 55 50 45 40 35 30 25 20 13 10 @ 480 nm analysis of a disperse dye Prepared Sample (mg/L) 0,006 | Absorbance 0,01 0,003 0,02 0,05 0,011 0,1 0,033 0,2 0,103 0,5 0,158 1 0,304 2 0,625 5 2,063 10 3,200 Homework Abs=0.025 Conc? mg/L 10 Incident Light Transmitted Light Abs=2.15 Conc=? mg/L @ 535 nm analysis of a reactive dye Prepared Sample (mg/L) Absorbance 0,15 0,002 0,3 0,005 0,75 0.009 1.5 0,027 3 0,086 7,5 0.132 15 0.253 30 0,521 75 1,719 150 2,667 Homework Conc.= 1.75 mg/L Abs.= ? 1. Incident Light Transmitted Light Conc.= 200 mg/L Abs.= ? Years Marmara Sea Black Sea Mediterranean Sea 1974 16 16,1 21,7 1978 15,5 15,6 21,7 1982 15,7 15,5 21.7 1986 15,5 15.7 21.4 1990 15,8 15,5 1994 16,6 15.4 21.9 1998 17,5 15,5 22,1 2002 15.6 15.8 22.4 2006 16,6 16,4 22.6 2010 16,1 16,1 22.4 2014 17 16,9 22,7 2018 17,4 16,9 22.7 2022 18,1 17,2 23,1 According to meteorological data, the average monthly seawater temperatures of three different seas between 1974-2022 are given. Accordingly, draw the graph showing the change of seawater by years for each sea and find the equation of the line that best fits the data for each sea and calculate the correlation coefficients, as well. 22.2
Step by Step Solution
There are 3 Steps involved in it

Get step-by-step solutions from verified subject matter experts