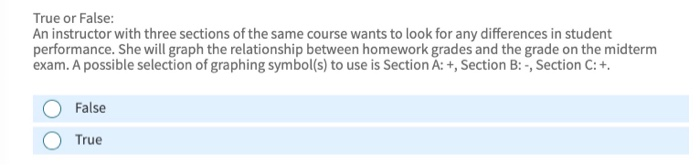
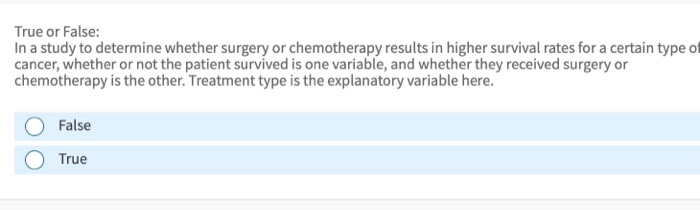
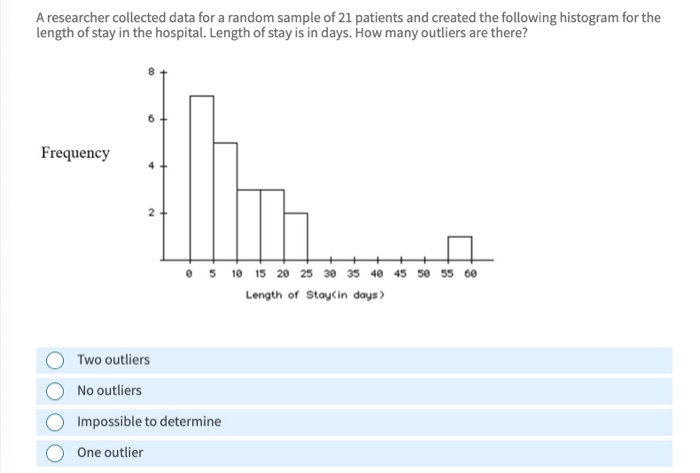
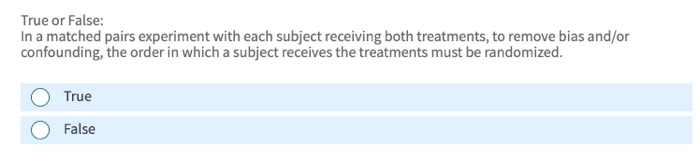
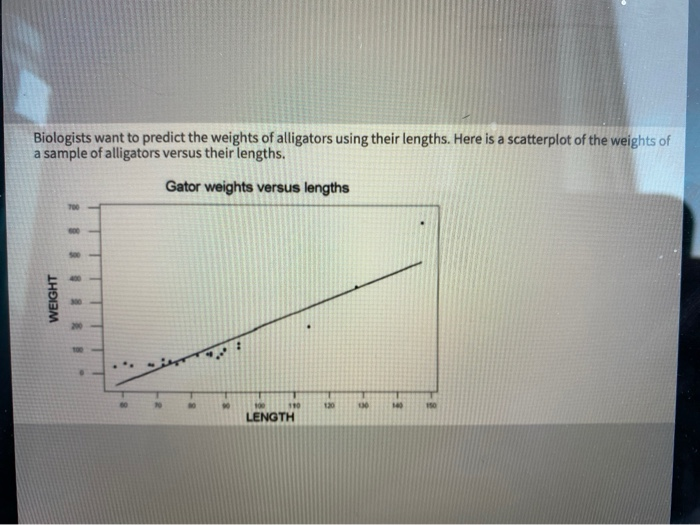
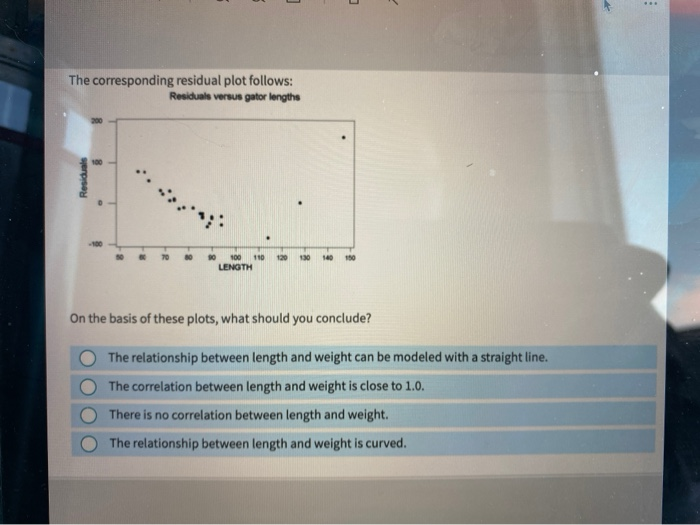
Question: 1. 2. 3. 4. True or False: An instructor with three sections of the same course wants to look for any differences in student performance.

1.
1. 2. 3. 4. True or False: An instructor with
2.
1. 2. 3. 4. True or False: An instructor with
3.
1. 2. 3. 4. True or False: An instructor with
4.
1. 2. 3. 4. True or False: An instructor with
True or False: An instructor with three sections of the same course wants to look for any differences in student performance. She will graph the relationship between homework grades and the grade on the midterm exam. A possible selection of graphing symbol(s) to use is Section A: +, Section B: -, Section C: +. False True True or False: In a study to determine whether surgery or chemotherapy results in higher survival rates for a certain type of cancer, whether or not the patient survived is one variable, and whether they received surgery or chemotherapy is the other. Treatment type is the explanatory variable here. False True A researcher collected data for a random sample of 21 patients and created the following histogram for the length of stay in the hospital. Length of stay is in days. How many outliers are there? Frequency 2 0 5 10 15 20 25 30 35 40 45 50 55 68 Length of Stayin days > Two outliers No outliers Impossible to determine One outlier True or False: In a matched pairs experiment with each subject receiving both treatments, to remove bias and/or confounding, the order in which a subject receives the treatments must be randomized. True False Biologists want to predict the weights of alligators using their lengths. Here is a scatterplot of the weights of a sample of alligators versus their lengths. Gator weights versus lengths 700 WEIGHT 130 110 LENGTH ) ... The corresponding residual plot follows: Residuals versus gator lengths Residuals 120 130 140 150 100 110 LENGTH On the basis of these plots, what should you conclude? The relationship between length and weight can be modeled with a straight line. The correlation between length and weight is close to 1.0. There is no correlation between length and weight. The relationship between length and weight is curved

Step by Step Solution

There are 3 Steps involved in it

1 Expert Approved Answer
Step: 1 Unlock blur-text-image
Question Has Been Solved by an Expert!

Get step-by-step solutions from verified subject matter experts

Step: 2 Unlock
Step: 3 Unlock

Students Have Also Explored These Related General Management Questions!