

Question: . . 1. 2. 3. (ROA) (ROE) . . Excel 2017 ( ) . ( ) . : (). (). (). 1500 . Balance Sheet
. .  1. 2. 3. (ROA) (ROE) . . Excel 2017 ( ) . ( )
. : (). (). (). 1500 .
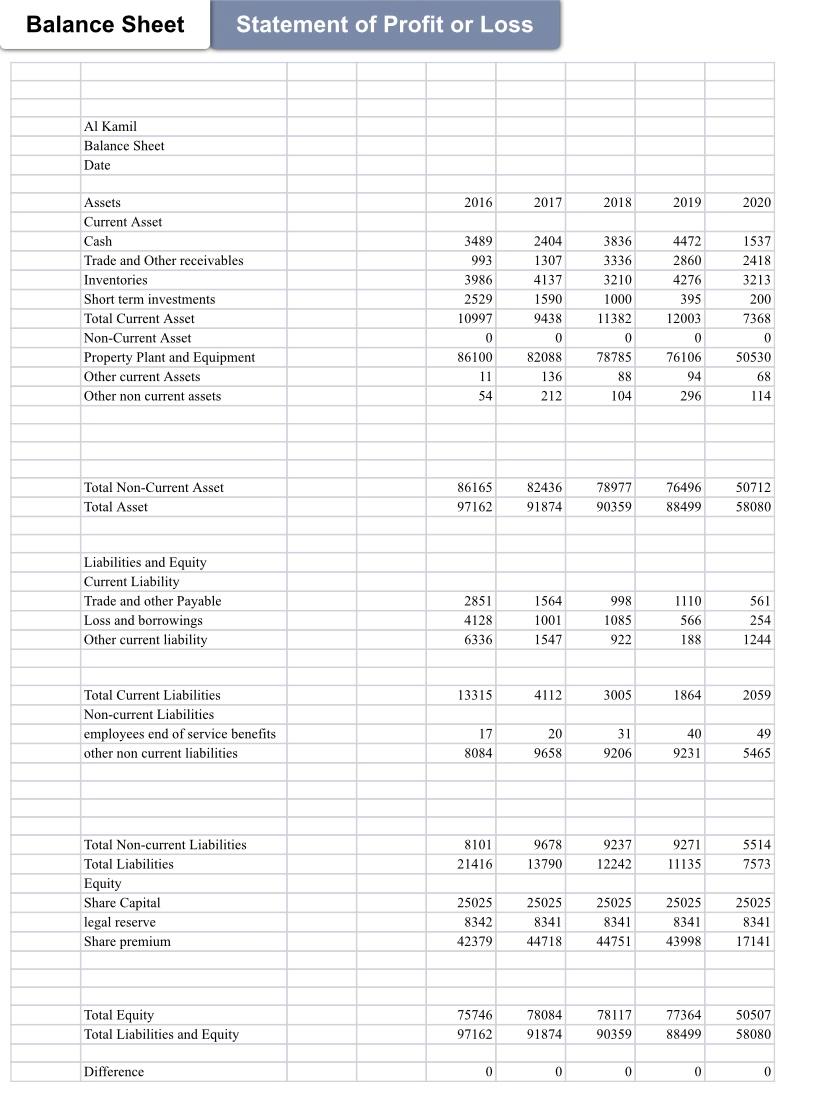
Balance Sheet Statement of Profit or Loss Al Kamil Balance Sheet Date 2016 2017 2018 2019 2020 4472 2860 Assets Current Asset Cash Trade and Other receivables Inventories Short term investments Total Current Asset Non-Current Asset Property Plant and Equipment Other current Assets Other non current assets 3489 993 3986 2529 10997 0 86100 11 2404 1307 4137 1590 9438 0 82088 136 212 3836 3336 3210 1000 11382 0 78785 88 104 4276 395 12003 0 76106 94 296 1537 2418 3213 200 7368 0 50530 68 114 54 76496 Total Non-Current Asset Total Asset 86165 97162 82436 91874 78977 90359 50712 58080 88499 Liabilities and Equity Current Liability Trade and other Payable Loss and borrowings Other current liability 2851 4128 6336 1564 1001 1547 998 1085 922 1110 566 188 561 254 1244 13315 4112 3005 1864 2059 Total Current Liabilities Non-current Liabilities employees end of service benefits other non current liabilities 17 8084 20 9658 31 9206 40 9231 49 5465 5514 8101 21416 9678 13790 9237 12242 9271 11135 7573 Total Non-current Liabilities Total Liabilities Equity Share Capital legal reserve Share premium 25025 8342 42379 25025 8341 44718 25025 8341 44751 25025 8341 43998 25025 8341 17141 Total Equity Total Liabilities and Equity 75746 97162 78084 91874 78117 90359 77364 88499 50507 58080 Difference 0 0 0 0 0 Balance Sheet Statement of Profit or Loss Al Kamil Balance Sheet Date 2016 2017 2018 2019 2020 4472 2860 Assets Current Asset Cash Trade and Other receivables Inventories Short term investments Total Current Asset Non-Current Asset Property Plant and Equipment Other current Assets Other non current assets 3489 993 3986 2529 10997 0 86100 11 2404 1307 4137 1590 9438 0 82088 136 212 3836 3336 3210 1000 11382 0 78785 88 104 4276 395 12003 0 76106 94 296 1537 2418 3213 200 7368 0 50530 68 114 54 76496 Total Non-Current Asset Total Asset 86165 97162 82436 91874 78977 90359 50712 58080 88499 Liabilities and Equity Current Liability Trade and other Payable Loss and borrowings Other current liability 2851 4128 6336 1564 1001 1547 998 1085 922 1110 566 188 561 254 1244 13315 4112 3005 1864 2059 Total Current Liabilities Non-current Liabilities employees end of service benefits other non current liabilities 17 8084 20 9658 31 9206 40 9231 49 5465 5514 8101 21416 9678 13790 9237 12242 9271 11135 7573 Total Non-current Liabilities Total Liabilities Equity Share Capital legal reserve Share premium 25025 8342 42379 25025 8341 44718 25025 8341 44751 25025 8341 43998 25025 8341 17141 Total Equity Total Liabilities and Equity 75746 97162 78084 91874 78117 90359 77364 88499 50507 58080 Difference 0 0 0 0 0
Step by Step Solution
There are 3 Steps involved in it

Get step-by-step solutions from verified subject matter experts