

Question: 1 2 . 4 For the leveling network shown in the accompanying figure, calculate the most probable elevations for x , Y , and Z
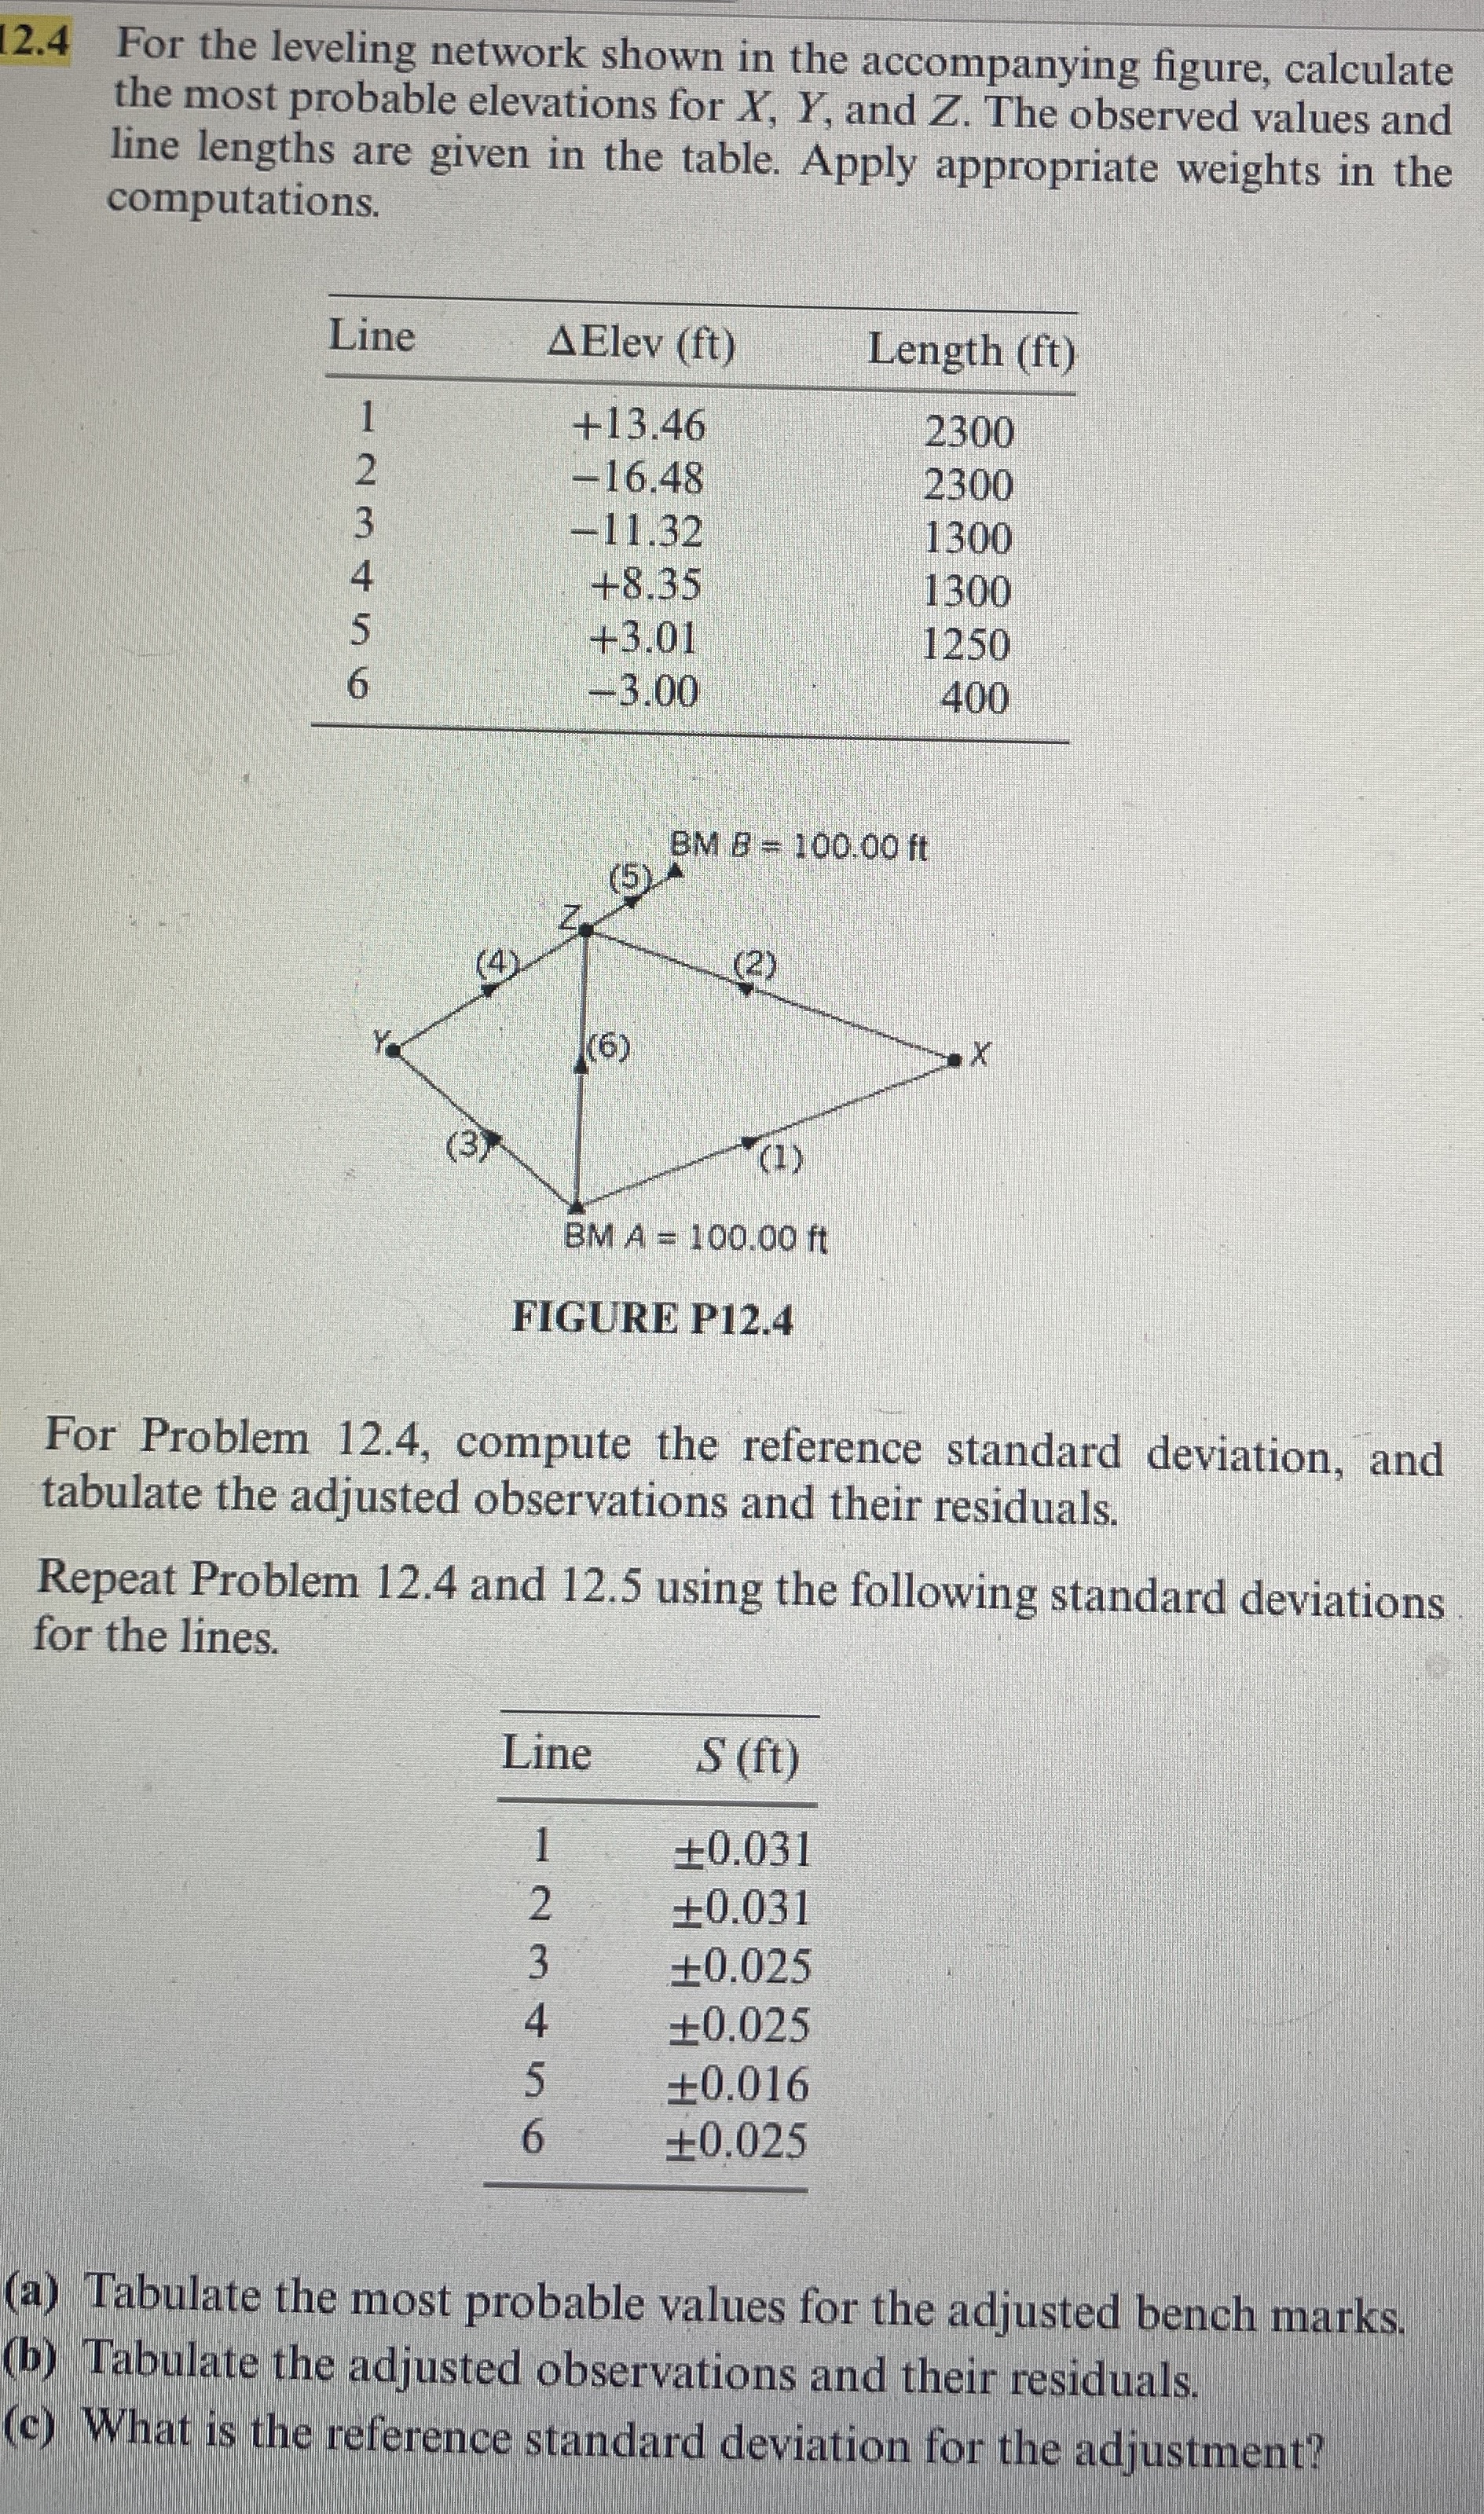
For the leveling network shown in the accompanying figure, calculate
the most probable elevations for and The observed values and
line lengths are given in the table. Apply appropriate weights in the
computations.
FIGURE P
For Problem compute the reference standard deviation, and
tabulate the adjusted observations and their residuals.
Repeat Problem and using the following standard deviations
for the lines.
a Tabulate the most probable values for the adjusted bench marks.
b Tabulate the adjusted observations and their residuals.
c What is the reference standard deviation for the adjustment?
Step by Step Solution
There are 3 Steps involved in it
1 Expert Approved Answer
Step: 1 Unlock

Question Has Been Solved by an Expert!
Get step-by-step solutions from verified subject matter experts
Step: 2 Unlock
Step: 3 Unlock