

Question: 1 2 . 4 The data below show the discharge ( Q m 3 s ) recorded at a gauging station between 2 6 and
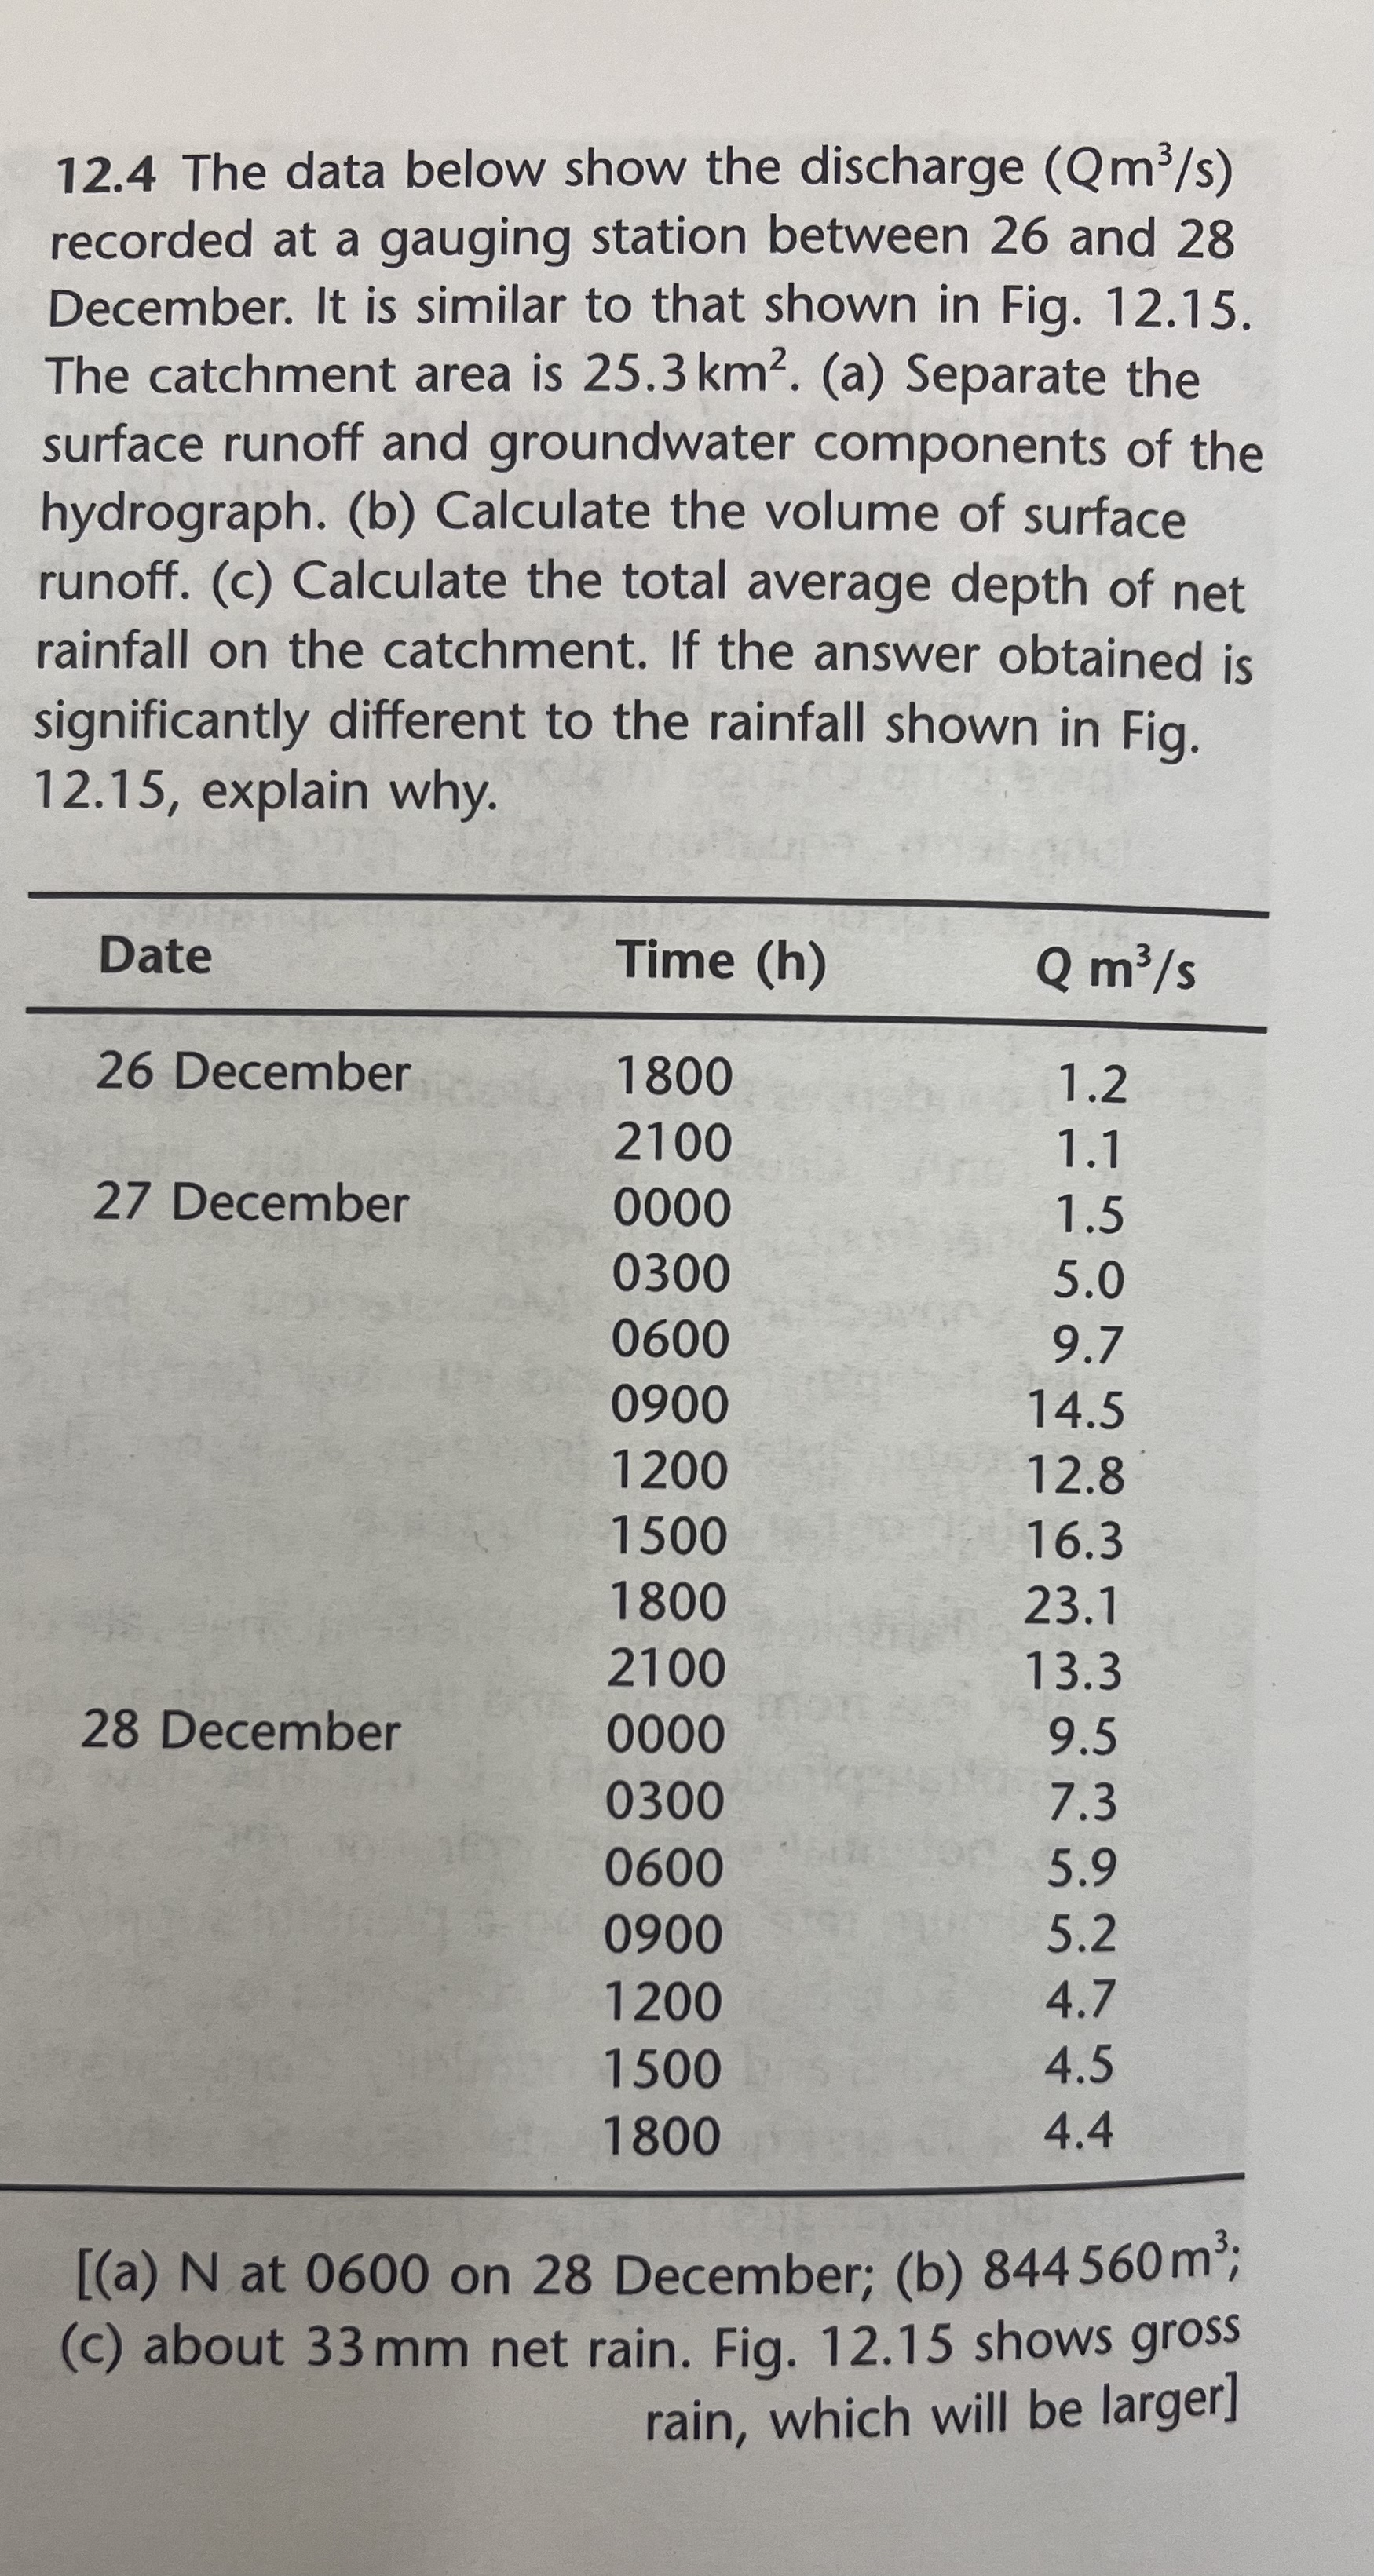
The data below show the discharge recorded at a gauging station between and December. It is similar to that shown in Fig. The catchment area is a Separate the surface runoff and groundwater components of the hydrograph. b Calculate the volume of surface runoff. c Calculate the total average depth of net rainfall on the catchment. If the answer obtained is significantly different to the rainfall shown in Fig. explain why.
tableDateTime
Step by Step Solution
There are 3 Steps involved in it
1 Expert Approved Answer
Step: 1 Unlock

Question Has Been Solved by an Expert!
Get step-by-step solutions from verified subject matter experts
Step: 2 Unlock
Step: 3 Unlock