Question: HULE. TS is all Ividual assignment. Problem 1 (5 point): Answer the following questions. See Homework 3 - Excel for further details. Recall the Company
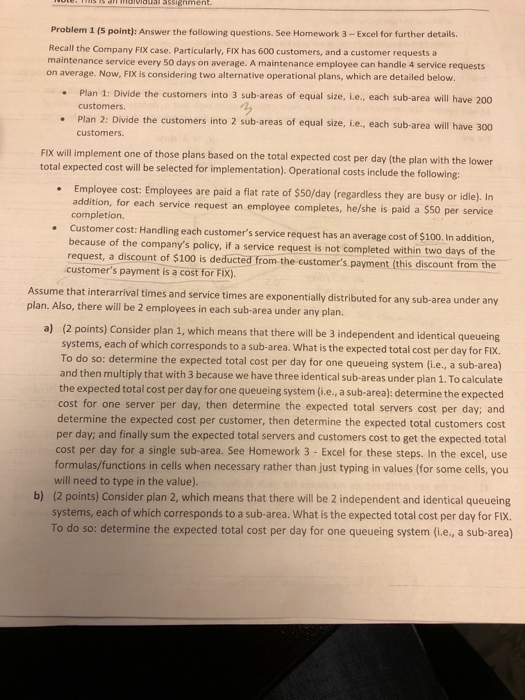
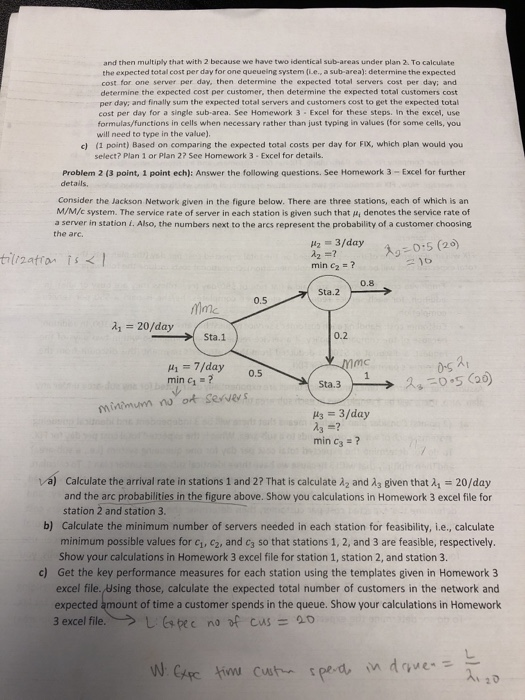
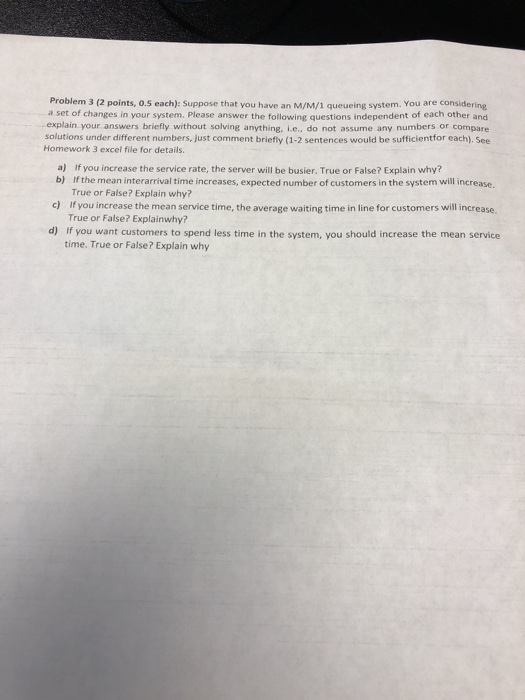
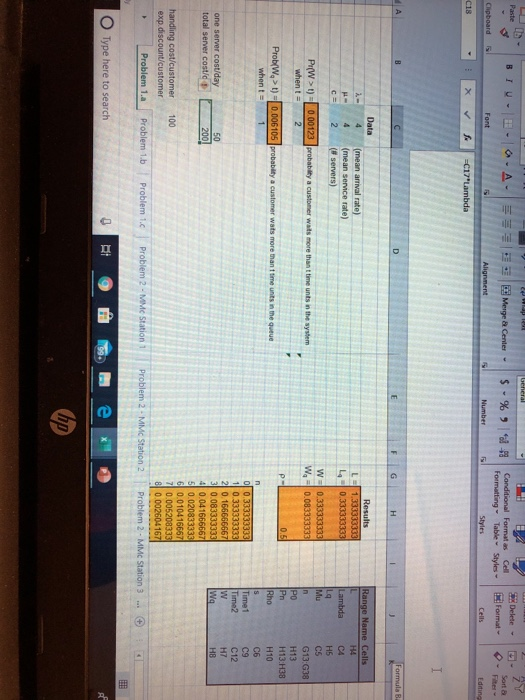
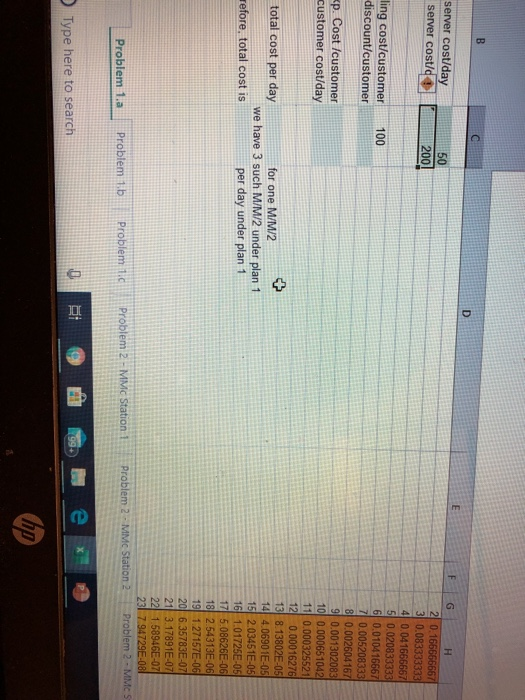
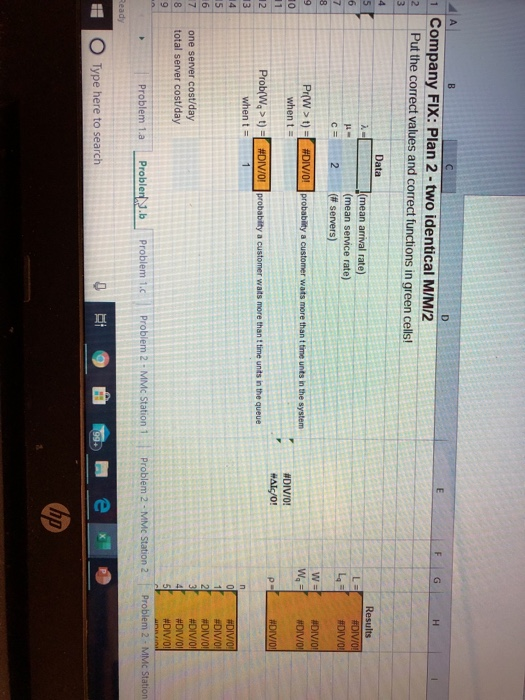
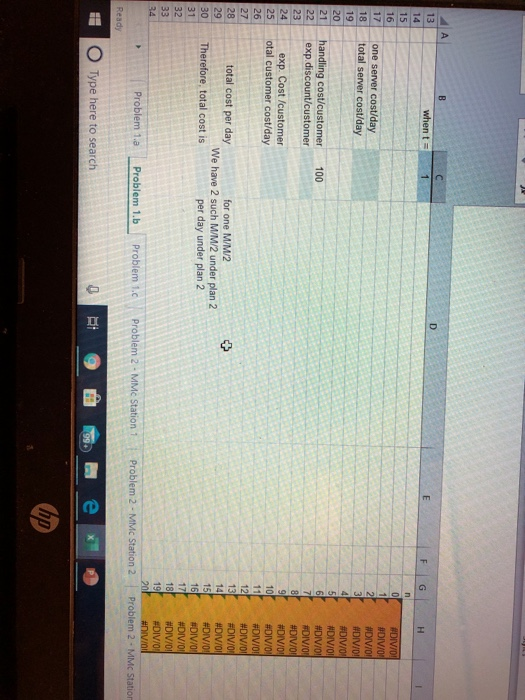
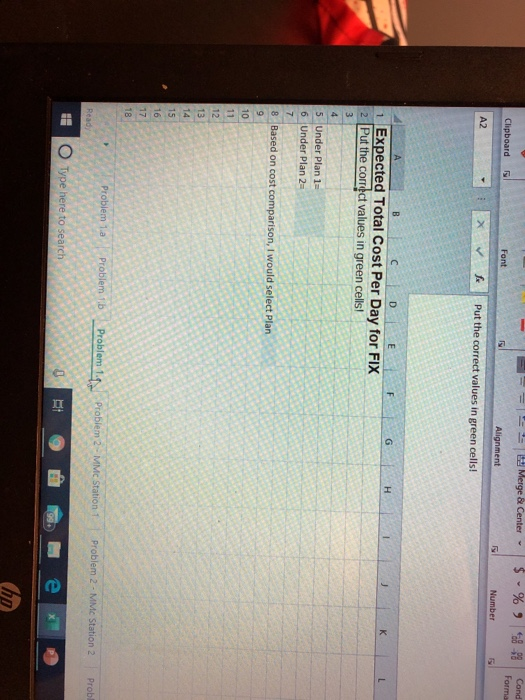
HULE. TS is all Ividual assignment. Problem 1 (5 point): Answer the following questions. See Homework 3 - Excel for further details. Recall the Company FIX case. Particularly, FIX has 600 customers, and a customer requests a maintenance service every 50 days on average. A maintenance employee can handle 4 service requests on average. Now, FIX is considering two alternative operational plans, which are detailed below. Plan 1: Divide the customers into 3 sub-areas of equal size, i.e., each sub-area will have 200 customers. Plan 2: Divide the customers into 2 sub-areas of equal size, i.e., each sub-area will have 300 customers. FIX will implement one of those plans based on the total expected cost per day (the plan with the lower total expected cost will be selected for implementation). Operational costs include the following: Employee cost: Employees are paid a flat rate of $50/day (regardless they are busy or idle). In addition, for each service request an employee completes, he/she is paid a $50 per service completion. Customer cost: Handling each customer's service request has an average cost of $100. In addition, because of the company's policy, if a service request is not completed within two days of the request, a discount of $100 is deducted from the customer's payment (this discount from the customer's payment is a cost for FIX). Assume that interarrival times and service times are exponentially distributed for any sub-area under any plan. Also, there will be 2 employees in each sub-area under any plan. a) (2 points) Consider plan 1, which means that there will be 3 independent and identical queueing systems, each of which corresponds to a sub-area. What is the expected total cost per day for FIX To do so: determine the expected total cost per day for one queueing system (ie, a sub-area) and then multiply that with 3 because we have three identical sub-areas under plan 1. To calculate the expected total cost per day for one queueing system (i.e., a sub-area): determine the expected cost for one server per day, then determine the expected total servers cost per day, and determine the expected cost per customer, then determine the expected total customers cost per day, and finally sum the expected total servers and customers cost to get the expected total cost per day for a single sub-area. See Homework 3 - Excel for these steps. In the excel, use formulas/functions in cells when necessary rather than just typing in values (for some cells, you will need to type in the value). b) (2 points) Consider plan 2, which means that there will be 2 independent and identical queueing systems, each of which corresponds to a sub-area. What is the expected total cost per day for FIX. To do so: determine the expected total cost per day for one queueing system (.e., a sub-area) and then multiply that with 2 because we have two identical sub-areas under plan. To calculate the expected total cost per day for one queueing system le a sub-areal: determine the expected cost for one server per day, then determine the expected total servers cost per day and determine the expected cost per customer, then determine the expected total customers cost per day, and finally sum the expected total servers and customers cost to get the expected total cost per day for a single sub-area. See Homework 3 - Excel for these steps. In the excel, use formulas/functions in cells when necessary rather than just typing in values for some cells, you will need to type in the value) cl (1 point) Based on comparing the expected total costs per day for FOX, which plan would you select Plan 1 or Plan 27 See Homework 3 - Excel for details Problem 2 (3 point, 1 point ech): Answer the following questions. See Homework 3 - Excel for further details Consider the Jackson Network given in the figure below. There are three stations, each of which is an M/M/c system. The service rate of server in each station is given such that, denotes the service rate of a server in station 1. Also, the numbers next to the arcs represent the probability of a customer choosing the arc. Hz = 3/day tillation is 2 =? min C2 = ? lo 2 =0:5 (20) Sta.2 mmc 1. = 20/day Sta.1 0.2 v mm 0.5% Hi = 7/day min c = ? Sta.3 2=0.5 (20) minimum no of servers Uz = 3/day 23 =? min c3 = ? va) Calculate the arrival rate in stations 1 and 2? That is calculate 12 and is given that l, - 20/day and the arc probabilities in the figure above. Show you calculations in Homework 3 excel file for station 2 and station 3 b) Calculate the minimum number of servers needed in each station for feasibility, i.e., calculate minimum possible values for C, C2, and C so that stations 1, 2, and 3 are feasible, respectively. Show your calculations in Homework 3 excel file for station 1, station 2, and station 3. c) Get the key performance measures for each station using the templates given in Homework 3 excel file. Using those, calculate the expected total number of customers in the network and expected amount of time a customer spends in the queue. Show your calculations in Homework 3 excel file. Lesbee no of cus = 20 W: Expc time custo spend in diuens Problem 3 (2 points, 0.5 each): Suppose that you have an M/M/1 queueing system. You are considering a set of changes in your system. Please answer the following questions independent of each other and explain your answers briefly without solving anything. Le do not assume any numbers or compare solutions under different numbers, just comment briefly (1-2 sentences would be sufficientfor each). See Homework 3 excel file for details. a) If you increase the service rate, the server will be busier. True or False? Explain why? b) If the mean interarrival time increases, expected number of customers in the system will increase True or False? Explain why? c) If you increase the mean service time, the average waiting time in line for customers will increase. True or False? Explainwhy? d) If you want customers to spend less time in the system, you should increase the mean service time. True or False? Explain why A Mergea Center S % Conditional Formats cell Formatting Table Styles Delete - Format Chipboard C18 X f C17'Lambda E F G H Formula B Range Name Cells 4 (mean arrival rate) (mean service rate) (servers) Results L 1,333333333 L 10.333333333 Lambda 2 H5 Pr(W > 1) - when t = 0.00123 probably a customer was more than t time unts in the system 2 W 0.333333333 W, 0.083333333 PO C5 G13:38 H13 H13:38 H10 Prob/W, > 1) = 0.006105 probability a customer wats more than time unts in the futu when I Rho C6 Time c9 C12 HT one server cost/day total server costo 50 200 HB 0 0.333333333 1 0.333333333 2 0.166666667 3 0.083333333 4 0.041666667 5 0.020833333 6 0.010416667 7 0.005208333 0.002604157 Problem 2 - MMC Station 3 100 handling cost/customer exp.discount/customer Problem 1.a Problem 1.b Problem 1. Problem 2 - MMC Station 1 Problem 2 - MMC Station 2 : Type here to search 9 69. e server cost/day server cost/ 2001 ling cost/customer discount/customer 100
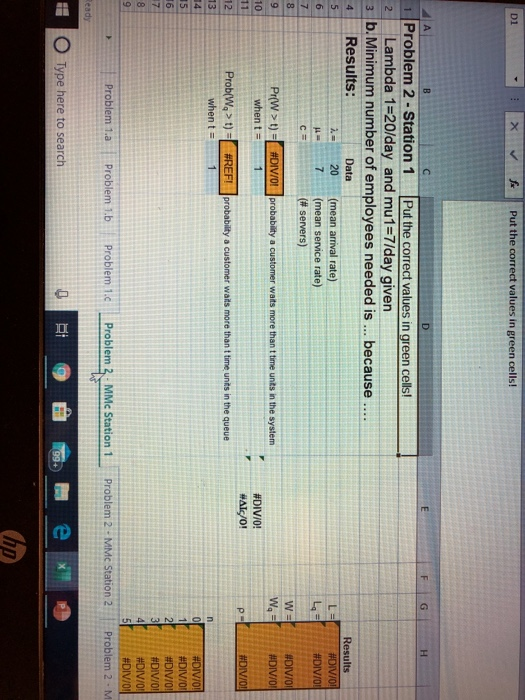
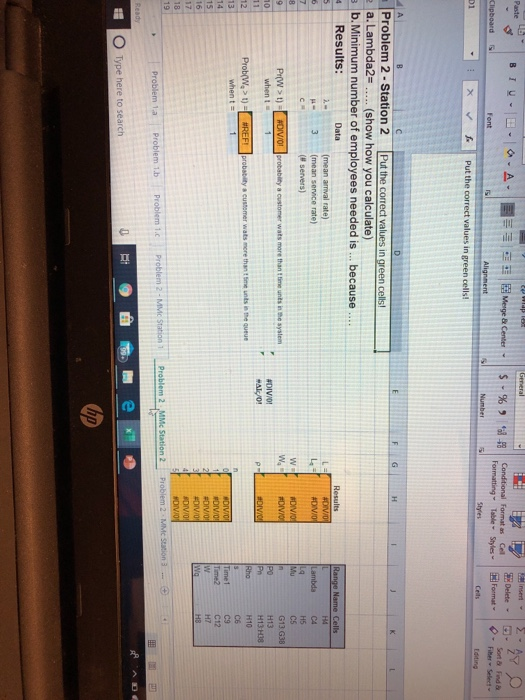
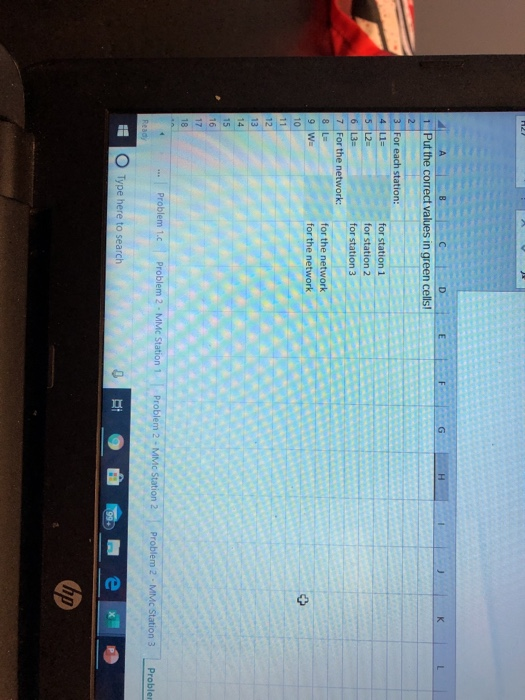
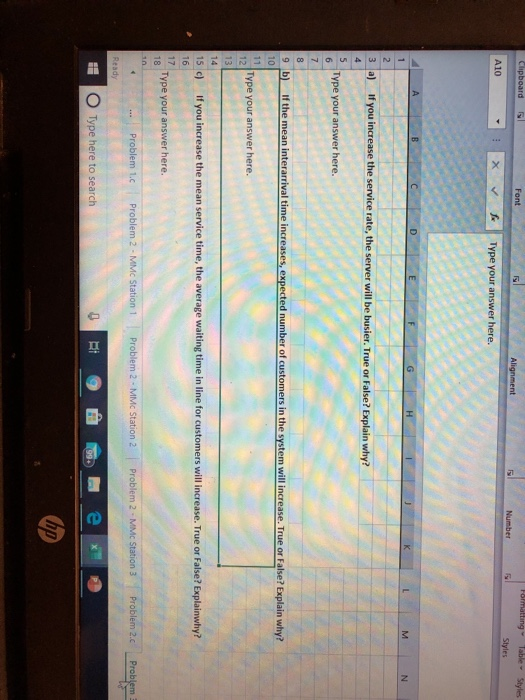
t)= when t = #DIV/0! probability a customer wats more than time unts in the system DOWNHO DOWN #DIV/0! #DIV/0! #DIV/0! #Alc/! #DIV/0! Prob(W, > t) = #DIV/0! probability a customer waits more than I time unts in the queue when ta #DIV/01 #DIV/0! #DIV/0! #DIV/0! #DIV/0! #DIV/0! one server cost/day total server cost/day Problem 1.a Probler 1.b Problem 1.C Problem 2 - MMC Station 1 Problem 2 - MMC Station 2 Problem 2. MMC Station Ready O Type here to search TFGLH when to one server cost/day total server cost/day 100 handling cost/customer exp.discount/customer exp. Cost /customer otal customer cost/day #DIV/0 #DIV/01 #OIVIO #DIV/O #DIV/OH #DIV/OI #DIV/0! #DIV/O #DIV/01 #DIV/0 #DIV/0! #DIV/OIL #DIV/Of #DIV/OP #DIV/ #DIV/OU DIV/0 #DIV/0! #DIV/0! #DIV/O total cost per day for one M/M2 We have 2 such MM/2 under plan 2 Therefore, total cost is per day under plan 2 SUBS #OVO Problem 1. Problem 1.b Problem 1.C Problem 2 - MMC Station 1 Problem 2 - MMC Station 2 Problem 2. MMC Statio Ready O Type here to search hp = = - Merge & Center $ % , 8-8 Clipboard Cond Forma Alignment Number f Put the correct values in green cells! IDLE LFGHIJ 1 Expected Total Cost Per Day for FIX 2 Put the correct values in green cells! 5 Under Plan 1 6 Under Plan 2 8 Based on cost comparison, I would select Plan Problem la Problem b Problem Problem 2 - MMC Station 1 Problem 2 - MMC Station 2 Probl Ready E O Type here to search ho D1 X Put the correct values in green cells! D E F G H 1 Problem 2 - Station 1 Put the correct values in green cells! Lambda 1=20/day and mu1=7/day given 3 b. Minimum number of employees needed is ... because Results: (mean arrival rate) (mean service rate) (# servers) Data 20 Results #DIV/0! #DIV/0! #DIV/0! #DIV/0! #DIV/0! probability a customer waits more than t time units in the system Pr(w>t) Whent #DIV/0! #AL/O! #DIV/0! #REFI probability a customer waits more than t time units in the queue Prob(W,>t) when t = NGUAGE #DIV/0! #DIV/01 #DIV/0! #DIV/0! #DIV/0! #DIV/01 Problem 2-M Problem 1.a Problem 1.b Problem 1.C Problem 3 MMc Station 1 Problem 2 - MMC Station 2 Ready O Type here to search hp B TV - A 2:29 Merge Center - S -% S - % -88 - Insert Delete- Format Conditional Format as Cel Formatting Table Styles Clipboard Cells 01 Corting X Put the correct values in green cells! F G H I J K L Problem 2 - Station 2 Put the correct values in green cells! a. Lambda2= .....(show how you calculate) Bb. Minimum number of employees needed is ... because Results: (mean arrival rate) Data Range Name Cells Results DIVID DVD (mean service rate) (server) Lambda FOIVO PrW>t) ADIV/0! probably a customer wats more than time unts in the system when #DIV/0! PAI01 CS G13 638 H13 H13HI8 H10 WREF! probably a customer was more thantments to the queue Prob(W Whent DIVO #DIV/0! FOIVO SOVO 18 19 Problem la Problem 1. b P roblem 1.C Problem 2 MM Station Problem 2 MMC Station Problem 2 MMC Station 2 Ready Rt 16. H Type here to search e HIJ K L A B C D 1 Put the correct values in green cells! 2 3 For each station: for station 1 5 L2 for station 2 for station 3 For the network: for the network for the network 4 LI= 9 W ... Problem 1. C Problem 2 MMC Station 1 Problem 2 - MMC Station 2 Problem 2 - MMC Station 3 Probler Type here to search Font 5 Chipboard A10 Alignment 1 x Type your answer here. A A B C D E F T 3 a) you increase the service rate, the server will be busier. True or False? Explain why? Type your answer here. 9 b) If the mean interarriva ises, expected number of customers in the system will increase. True or False? Explain why? Type your answer he 15 c) If you increase ti in service time, the average waiting time in line for customers will increase. True or False? Explainwhy? 16 Type your answer he ... Problem 1.C Problem 2 - MMC Station 1 Problem 2 - MMC Station 2 Problem 2 - MMC Station 3 Problem 2. Problem # O Type here to search Ri9 199. e x - Font Mergea Center - Clipboard $ % & s Conditional Formatas Cell Formatting Table Styles Alignment A10 Number 1 X > Type your answer here. lo DT F L M N 9 b) if the mean interarrival time increases, expected number of customers in the system will increase. True or False? Explain why? Type your answer here. 12/peo 14 15 c) If you increase the mean service time, the average waiting time in line for customers will increase. True or False? Explainwhy? Type your answer here 21 d) If you ant customers to spend less time in the system, you should increase the mean service time. True or False? Explain why Type your answer here. . .. Problem 1.6 Problem 2 - MMC Station 1 Problem 2 - MMC Station 2 Problem 2 - MMC Station 3 Ready Problem 2. Problem 3 Type here to search O .e HULE. TS is all Ividual assignment. Problem 1 (5 point): Answer the following questions. See Homework 3 - Excel for further details. Recall the Company FIX case. Particularly, FIX has 600 customers, and a customer requests a maintenance service every 50 days on average. A maintenance employee can handle 4 service requests on average. Now, FIX is considering two alternative operational plans, which are detailed below. Plan 1: Divide the customers into 3 sub-areas of equal size, i.e., each sub-area will have 200 customers. Plan 2: Divide the customers into 2 sub-areas of equal size, i.e., each sub-area will have 300 customers. FIX will implement one of those plans based on the total expected cost per day (the plan with the lower total expected cost will be selected for implementation). Operational costs include the following: Employee cost: Employees are paid a flat rate of $50/day (regardless they are busy or idle). In addition, for each service request an employee completes, he/she is paid a $50 per service completion. Customer cost: Handling each customer's service request has an average cost of $100. In addition, because of the company's policy, if a service request is not completed within two days of the request, a discount of $100 is deducted from the customer's payment (this discount from the customer's payment is a cost for FIX). Assume that interarrival times and service times are exponentially distributed for any sub-area under any plan. Also, there will be 2 employees in each sub-area under any plan. a) (2 points) Consider plan 1, which means that there will be 3 independent and identical queueing systems, each of which corresponds to a sub-area. What is the expected total cost per day for FIX To do so: determine the expected total cost per day for one queueing system (ie, a sub-area) and then multiply that with 3 because we have three identical sub-areas under plan 1. To calculate the expected total cost per day for one queueing system (i.e., a sub-area): determine the expected cost for one server per day, then determine the expected total servers cost per day, and determine the expected cost per customer, then determine the expected total customers cost per day, and finally sum the expected total servers and customers cost to get the expected total cost per day for a single sub-area. See Homework 3 - Excel for these steps. In the excel, use formulas/functions in cells when necessary rather than just typing in values (for some cells, you will need to type in the value). b) (2 points) Consider plan 2, which means that there will be 2 independent and identical queueing systems, each of which corresponds to a sub-area. What is the expected total cost per day for FIX. To do so: determine the expected total cost per day for one queueing system (.e., a sub-area) and then multiply that with 2 because we have two identical sub-areas under plan. To calculate the expected total cost per day for one queueing system le a sub-areal: determine the expected cost for one server per day, then determine the expected total servers cost per day and determine the expected cost per customer, then determine the expected total customers cost per day, and finally sum the expected total servers and customers cost to get the expected total cost per day for a single sub-area. See Homework 3 - Excel for these steps. In the excel, use formulas/functions in cells when necessary rather than just typing in values for some cells, you will need to type in the value) cl (1 point) Based on comparing the expected total costs per day for FOX, which plan would you select Plan 1 or Plan 27 See Homework 3 - Excel for details Problem 2 (3 point, 1 point ech): Answer the following questions. See Homework 3 - Excel for further details Consider the Jackson Network given in the figure below. There are three stations, each of which is an M/M/c system. The service rate of server in each station is given such that, denotes the service rate of a server in station 1. Also, the numbers next to the arcs represent the probability of a customer choosing the arc. Hz = 3/day tillation is 2 =? min C2 = ? lo 2 =0:5 (20) Sta.2 mmc 1. = 20/day Sta.1 0.2 v mm 0.5% Hi = 7/day min c = ? Sta.3 2=0.5 (20) minimum no of servers Uz = 3/day 23 =? min c3 = ? va) Calculate the arrival rate in stations 1 and 2? That is calculate 12 and is given that l, - 20/day and the arc probabilities in the figure above. Show you calculations in Homework 3 excel file for station 2 and station 3 b) Calculate the minimum number of servers needed in each station for feasibility, i.e., calculate minimum possible values for C, C2, and C so that stations 1, 2, and 3 are feasible, respectively. Show your calculations in Homework 3 excel file for station 1, station 2, and station 3. c) Get the key performance measures for each station using the templates given in Homework 3 excel file. Using those, calculate the expected total number of customers in the network and expected amount of time a customer spends in the queue. Show your calculations in Homework 3 excel file. Lesbee no of cus = 20 W: Expc time custo spend in diuens Problem 3 (2 points, 0.5 each): Suppose that you have an M/M/1 queueing system. You are considering a set of changes in your system. Please answer the following questions independent of each other and explain your answers briefly without solving anything. Le do not assume any numbers or compare solutions under different numbers, just comment briefly (1-2 sentences would be sufficientfor each). See Homework 3 excel file for details. a) If you increase the service rate, the server will be busier. True or False? Explain why? b) If the mean interarrival time increases, expected number of customers in the system will increase True or False? Explain why? c) If you increase the mean service time, the average waiting time in line for customers will increase. True or False? Explainwhy? d) If you want customers to spend less time in the system, you should increase the mean service time. True or False? Explain why A Mergea Center S % Conditional Formats cell Formatting Table Styles Delete - Format Chipboard C18 X f C17'Lambda E F G H Formula B Range Name Cells 4 (mean arrival rate) (mean service rate) (servers) Results L 1,333333333 L 10.333333333 Lambda 2 H5 Pr(W > 1) - when t = 0.00123 probably a customer was more than t time unts in the system 2 W 0.333333333 W, 0.083333333 PO C5 G13:38 H13 H13:38 H10 Prob/W, > 1) = 0.006105 probability a customer wats more than time unts in the futu when I Rho C6 Time c9 C12 HT one server cost/day total server costo 50 200 HB 0 0.333333333 1 0.333333333 2 0.166666667 3 0.083333333 4 0.041666667 5 0.020833333 6 0.010416667 7 0.005208333 0.002604157 Problem 2 - MMC Station 3 100 handling cost/customer exp.discount/customer Problem 1.a Problem 1.b Problem 1. Problem 2 - MMC Station 1 Problem 2 - MMC Station 2 : Type here to search 9 69. e server cost/day server cost/ 2001 ling cost/customer discount/customer 100 t)= when t = #DIV/0! probability a customer wats more than time unts in the system DOWNHO DOWN #DIV/0! #DIV/0! #DIV/0! #Alc/! #DIV/0! Prob(W, > t) = #DIV/0! probability a customer waits more than I time unts in the queue when ta #DIV/01 #DIV/0! #DIV/0! #DIV/0! #DIV/0! #DIV/0! one server cost/day total server cost/day Problem 1.a Probler 1.b Problem 1.C Problem 2 - MMC Station 1 Problem 2 - MMC Station 2 Problem 2. MMC Station Ready O Type here to search TFGLH when to one server cost/day total server cost/day 100 handling cost/customer exp.discount/customer exp. Cost /customer otal customer cost/day #DIV/0 #DIV/01 #OIVIO #DIV/O #DIV/OH #DIV/OI #DIV/0! #DIV/O #DIV/01 #DIV/0 #DIV/0! #DIV/OIL #DIV/Of #DIV/OP #DIV/ #DIV/OU DIV/0 #DIV/0! #DIV/0! #DIV/O total cost per day for one M/M2 We have 2 such MM/2 under plan 2 Therefore, total cost is per day under plan 2 SUBS #OVO Problem 1. Problem 1.b Problem 1.C Problem 2 - MMC Station 1 Problem 2 - MMC Station 2 Problem 2. MMC Statio Ready O Type here to search hp = = - Merge & Center $ % , 8-8 Clipboard Cond Forma Alignment Number f Put the correct values in green cells! IDLE LFGHIJ 1 Expected Total Cost Per Day for FIX 2 Put the correct values in green cells! 5 Under Plan 1 6 Under Plan 2 8 Based on cost comparison, I would select Plan Problem la Problem b Problem Problem 2 - MMC Station 1 Problem 2 - MMC Station 2 Probl Ready E O Type here to search ho D1 X Put the correct values in green cells! D E F G H 1 Problem 2 - Station 1 Put the correct values in green cells! Lambda 1=20/day and mu1=7/day given 3 b. Minimum number of employees needed is ... because Results: (mean arrival rate) (mean service rate) (# servers) Data 20 Results #DIV/0! #DIV/0! #DIV/0! #DIV/0! #DIV/0! probability a customer waits more than t time units in the system Pr(w>t) Whent #DIV/0! #AL/O! #DIV/0! #REFI probability a customer waits more than t time units in the queue Prob(W,>t) when t = NGUAGE #DIV/0! #DIV/01 #DIV/0! #DIV/0! #DIV/0! #DIV/01 Problem 2-M Problem 1.a Problem 1.b Problem 1.C Problem 3 MMc Station 1 Problem 2 - MMC Station 2 Ready O Type here to search hp B TV - A 2:29 Merge Center - S -% S - % -88 - Insert Delete- Format Conditional Format as Cel Formatting Table Styles Clipboard Cells 01 Corting X Put the correct values in green cells! F G H I J K L Problem 2 - Station 2 Put the correct values in green cells! a. Lambda2= .....(show how you calculate) Bb. Minimum number of employees needed is ... because Results: (mean arrival rate) Data Range Name Cells Results DIVID DVD (mean service rate) (server) Lambda FOIVO PrW>t) ADIV/0! probably a customer wats more than time unts in the system when #DIV/0! PAI01 CS G13 638 H13 H13HI8 H10 WREF! probably a customer was more thantments to the queue Prob(W Whent DIVO #DIV/0! FOIVO SOVO 18 19 Problem la Problem 1. b P roblem 1.C Problem 2 MM Station Problem 2 MMC Station Problem 2 MMC Station 2 Ready Rt 16. H Type here to search e HIJ K L A B C D 1 Put the correct values in green cells! 2 3 For each station: for station 1 5 L2 for station 2 for station 3 For the network: for the network for the network 4 LI= 9 W ... Problem 1. C Problem 2 MMC Station 1 Problem 2 - MMC Station 2 Problem 2 - MMC Station 3 Probler Type here to search Font 5 Chipboard A10 Alignment 1 x Type your answer here. A A B C D E F T 3 a) you increase the service rate, the server will be busier. True or False? Explain why? Type your answer here. 9 b) If the mean interarriva ises, expected number of customers in the system will increase. True or False? Explain why? Type your answer he 15 c) If you increase ti in service time, the average waiting time in line for customers will increase. True or False? Explainwhy? 16 Type your answer he ... Problem 1.C Problem 2 - MMC Station 1 Problem 2 - MMC Station 2 Problem 2 - MMC Station 3 Problem 2. Problem # O Type here to search Ri9 199. e x - Font Mergea Center - Clipboard $ % & s Conditional Formatas Cell Formatting Table Styles Alignment A10 Number 1 X > Type your answer here. lo DT F L M N 9 b) if the mean interarrival time increases, expected number of customers in the system will increase. True or False? Explain why? Type your answer here. 12/peo 14 15 c) If you increase the mean service time, the average waiting time in line for customers will increase. True or False? Explainwhy? Type your answer here 21 d) If you ant customers to spend less time in the system, you should increase the mean service time. True or False? Explain why Type your answer here. . .. Problem 1.6 Problem 2 - MMC Station 1 Problem 2 - MMC Station 2 Problem 2 - MMC Station 3 Ready Problem 2. Problem 3 Type here to search O .e