

Question: You are faced with the probability distribution of the HPR on the stock market index fund given in Spreadsheet 5.1 of the text. Suppose
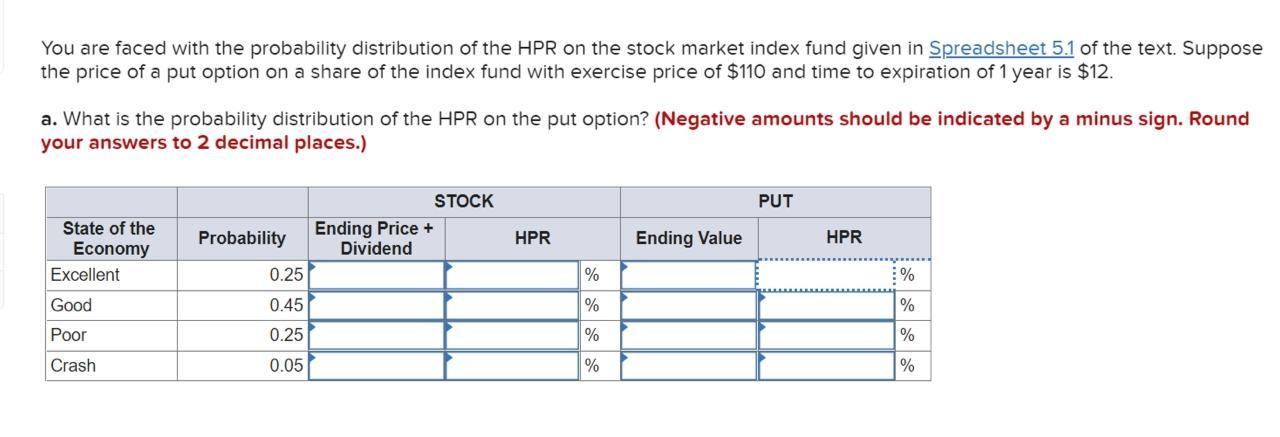
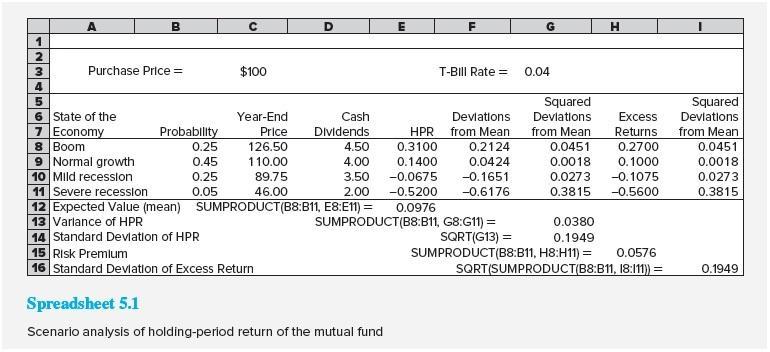
You are faced with the probability distribution of the HPR on the stock market index fund given in Spreadsheet 5.1 of the text. Suppose the price of a put option on a share of the index fund with exercise price of $110 and time to expiration of 1 year is $12. a. What is the probability distribution of the HPR on the put option? (Negative amounts should be indicated by a minus sign. Round your answers to 2 decimal places.) State of the Economy Excellent Good Poor Crash Probability 0.25 0.45 0.25 0.05 Ending Price + Dividend STOCK HPR % % % % Ending Value PUT HPR % % % % 1 2 A Purchase Price = 3 4 5 6 State of the 7 Economy 8 Boom 9 Normal growth 10 Mild recession Probability 0.25 0.45 0.25 0.05 $100 Year-End Price 126.50 110.00 89.75 46.00 D 11 Severe recession 12 Expected Value (mean) 13 Varlance of HPR 14 Standard Deviation of HPR 15 Risk Premium 16 Standard Deviation of Excess Return Cash Dividends 0.3100 0.1400 -0.0675 -0.5200 SUMPRODUCT(B8:B11, E8:E11) = 0.0976 4.50 4.00 3.50 2.00 T-Bill Rate = Deviations HPR from Mean 0.2124 0.0424 Spreadsheet 5.1 Scenario analysis of holding-period return of the mutual fund -0.1651 -0.6176 0.04 Squared Deviations Excess Returns 0.2700 0.1000 0.0273 -0.1075 0.3815 -0.5600 from Mean 0.0451 0.0018 SUMPRODUCT(B8:B11, G8:G11) = SQRT(G13) = SUMPRODUCT(B8:B11, H8:H11) = H 0.0380 0.1949 0.0576 _SQRT(SUMPRODUCT(B8:B11, 18:111)) = Squared Deviations from Mean 0.0451 0.0018 0.0273 0.3815 0.1949
Step by Step Solution
There are 3 Steps involved in it
To determine the probability distribution of the holdingperiod return HPR on the put option we need ... View full answer

Get step-by-step solutions from verified subject matter experts