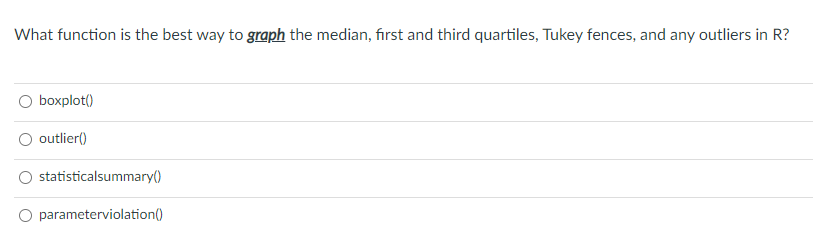
Question: 1. 2. What function is the best way to graph the median, first and third quartiles, Tukey fences, and any outliers in R? boxploto outlier)

1.

1. 2. What function is the best way to graph the

2.

1. 2. What function is the best way to graph the

1. 2. What function is the best way to graph the

What function is the best way to graph the median, first and third quartiles, Tukey fences, and any outliers in R? boxploto outlier) statisticalsummaryo O parameterviolation() Match the term to the definition. Count the number of elements you have in your vector [Choose ] Displays the current working directory [Choose ] Use logical statements to obtain values such as values

Step by Step Solution

There are 3 Steps involved in it

1 Expert Approved Answer
Step: 1 Unlock blur-text-image
Question Has Been Solved by an Expert!

Get step-by-step solutions from verified subject matter experts

Step: 2 Unlock
Step: 3 Unlock

Students Have Also Explored These Related General Management Questions!