

Question: 1. (20pt - Turn in ) The data is the daily high temperature during April in Paso Robles, Ca. The National Weather Center claims that
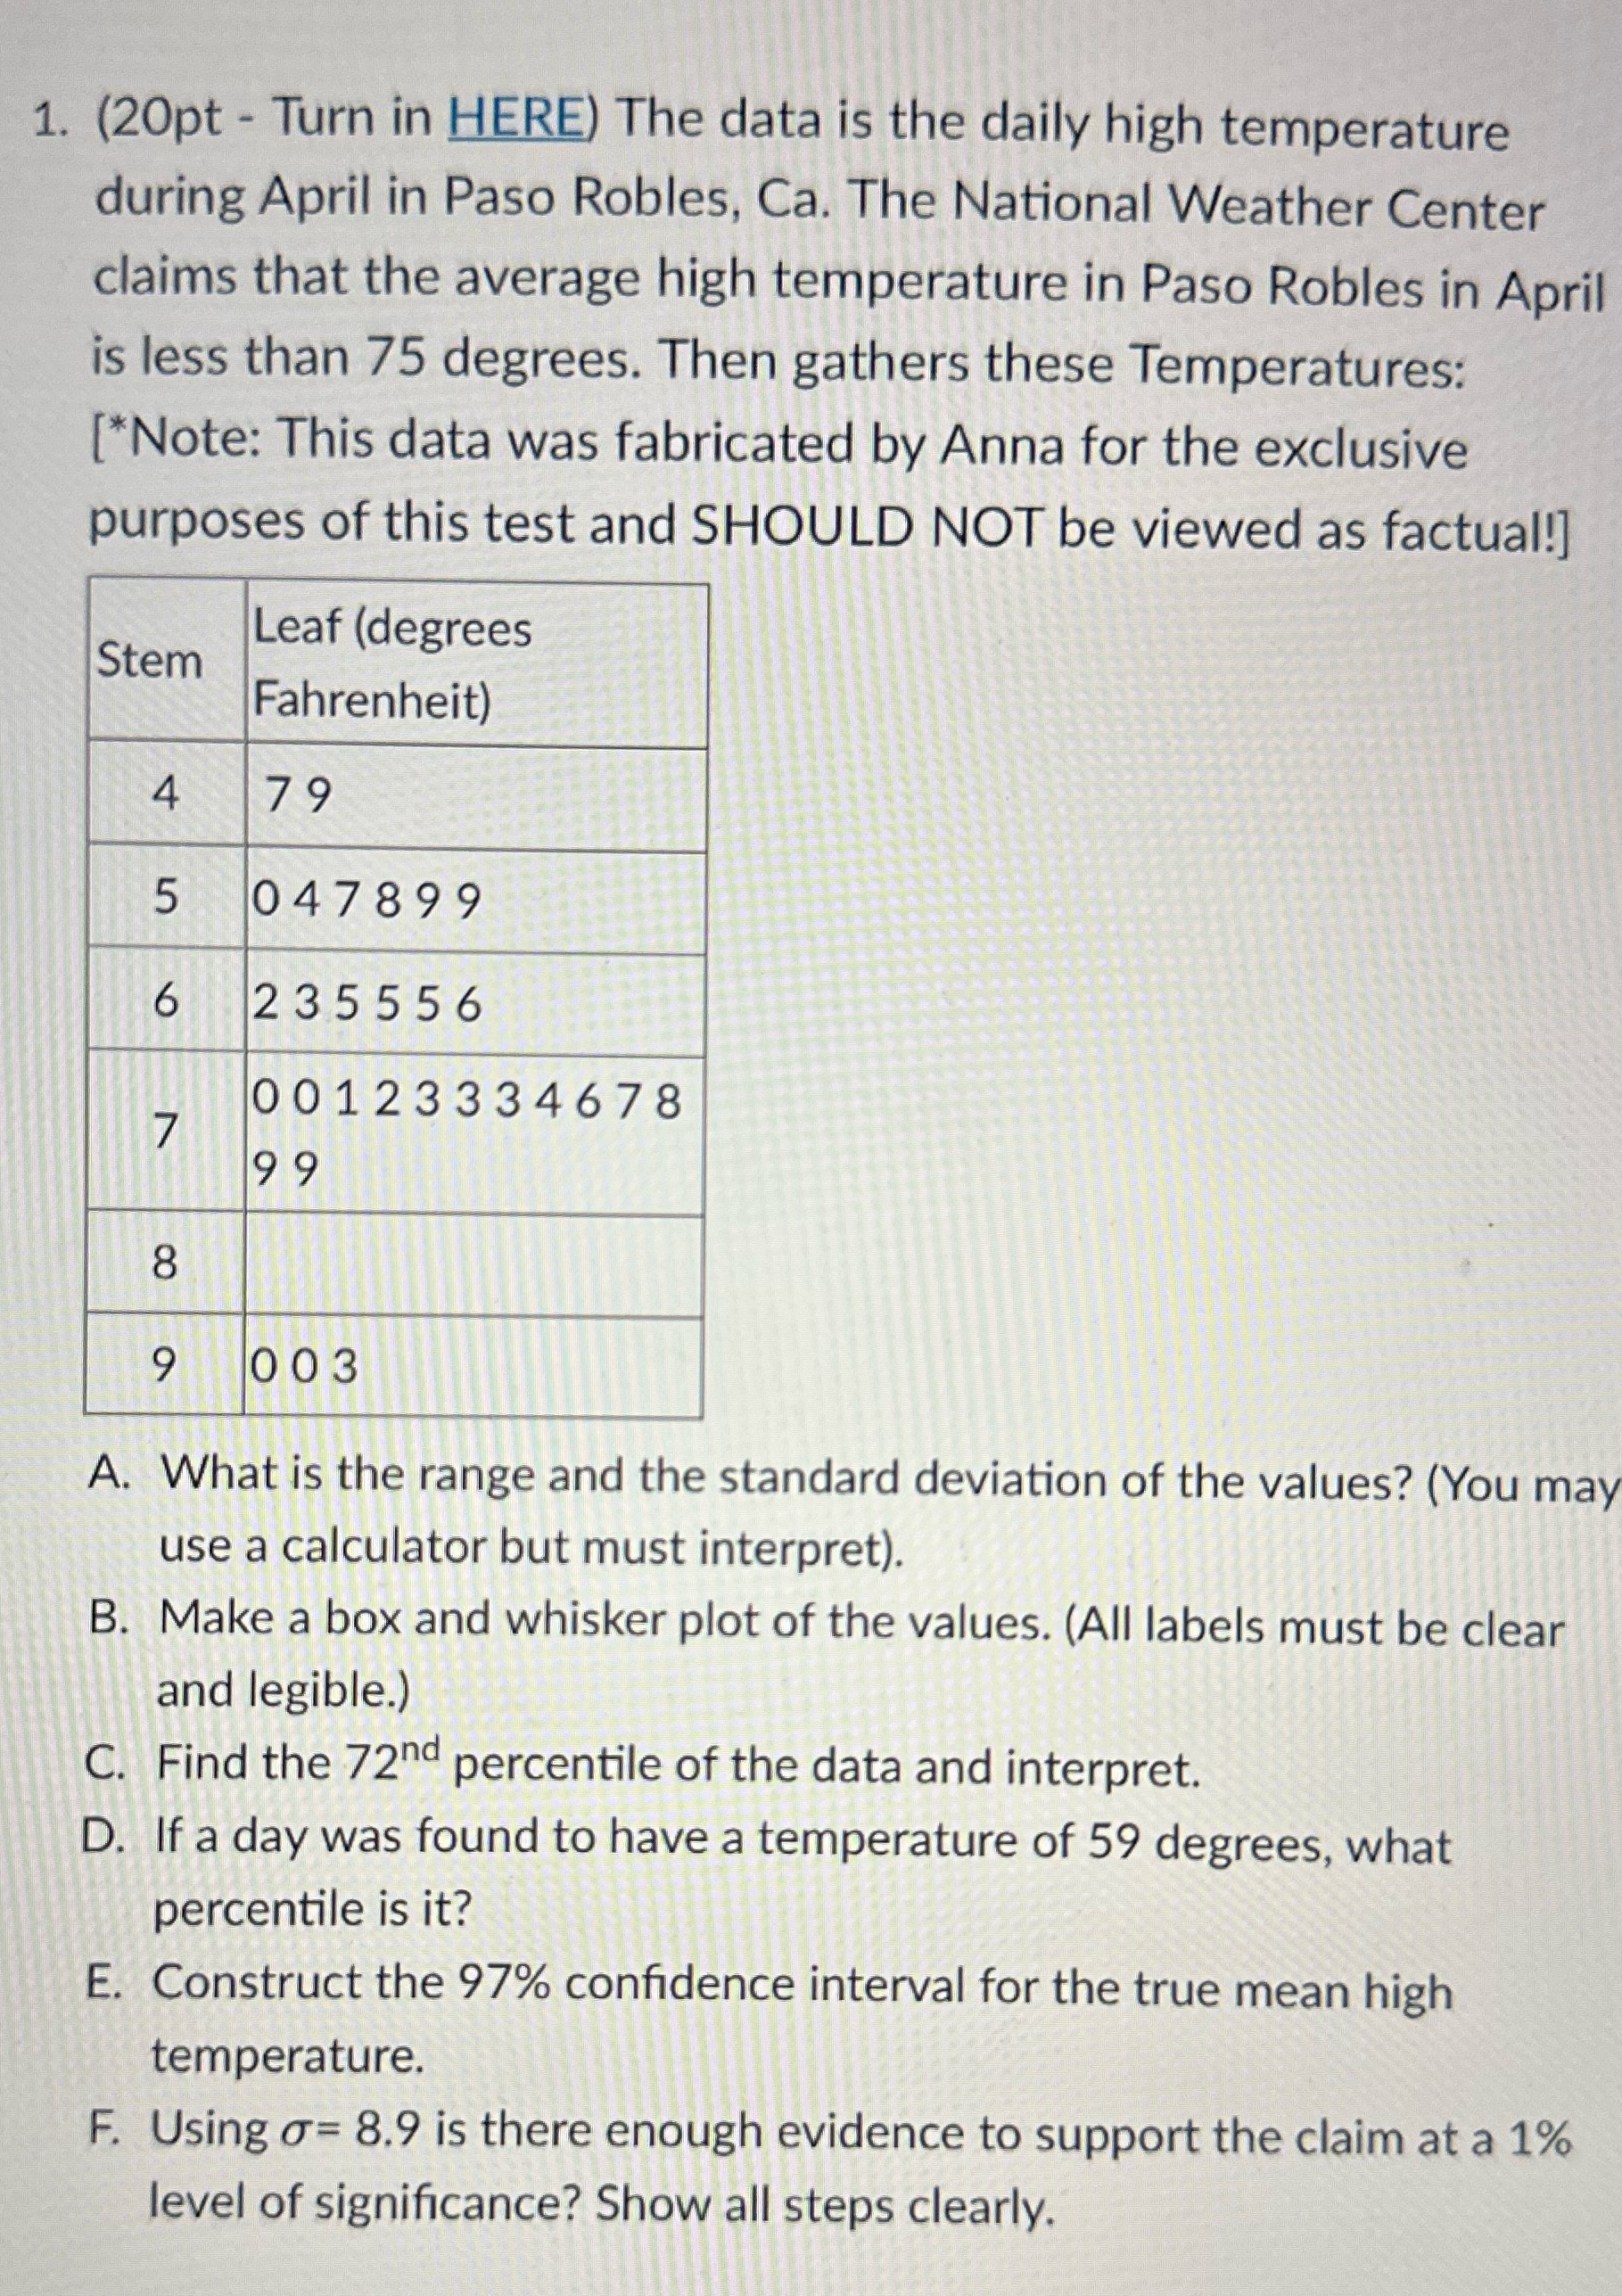
1. (20pt - Turn in ) The data is the daily high temperature during April in Paso Robles, Ca. The National Weather Center claims that the average high temperature in Paso Robles in April is less than 75 degrees. Then gathers these Temperatures: [*Note: This data was fabricated by Anna for the exclusive purposes of this test and SHOULD NOT be viewed as factuali] . Leaf, (degrees 1 Stem I Fahrenheit) A. What is the range and the standard deviation of the values? (You may use a calculator but must interpret). B. Make a box and whisker plot of the values. (All labels must be clear and legible.) C. Find the 72nd percentile of the data and interpret. D. it .a day was found to have a temperature of 59 degrees, what percentile is it? E. Construct the 97% condence interval for the true mean high temperature. F. Using U= 8.9 is there enough evidence to support the claim at a 1% level of signicance? Show all steps clearly
Step by Step Solution
There are 3 Steps involved in it

Get step-by-step solutions from verified subject matter experts