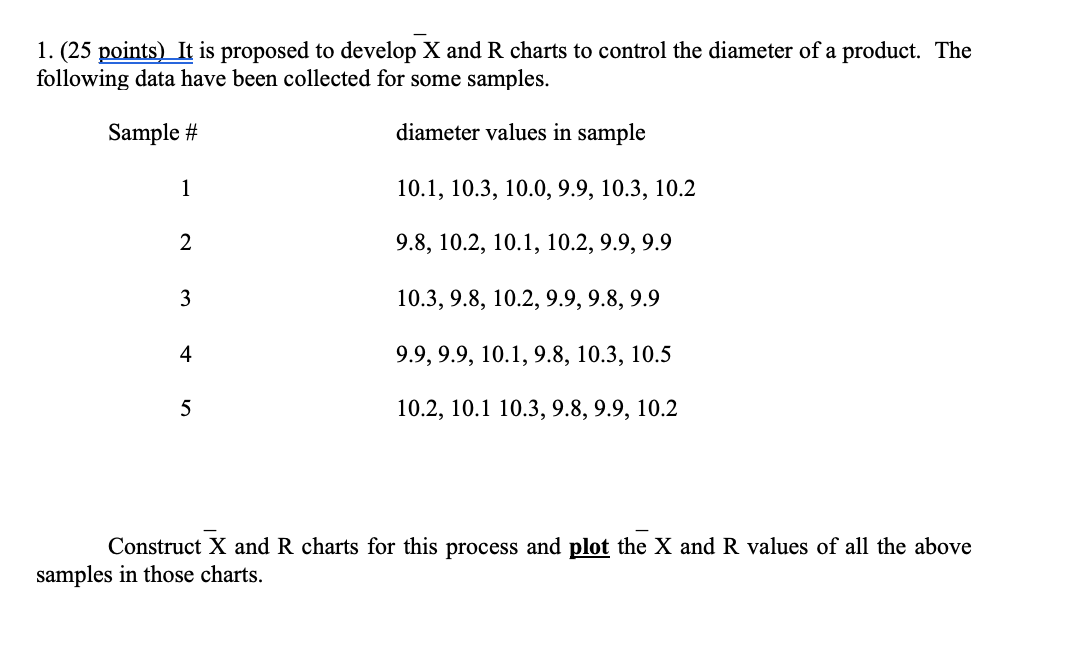
Question: 1. (25 points) It is proposed to develop X and R charts to control the diameter of a product. The following data have been collected

1. (25 points) It is proposed to develop X and R

1. (25 points) It is proposed to develop X and R charts to control the diameter of a product. The following data have been collected for some samples. Sample # diameter values in sample 1 10.1, 10.3, 10.0, 9.9, 10.3, 10.2 2 9.8, 10.2, 10.1, 10.2, 9.9, 9.9 3 10.3, 9.8, 10.2, 9.9, 9.8, 9.9 4 9.9,9.9, 10.1, 9.8, 10.3, 10.5 5 10.2, 10.1 10.3, 9.8, 9.9, 10.2 Construct X and R charts for this process and plot the X and R values of all the above samples in those charts

Step by Step Solution

There are 3 Steps involved in it

1 Expert Approved Answer
Step: 1 Unlock blur-text-image
Question Has Been Solved by an Expert!

Get step-by-step solutions from verified subject matter experts

Step: 2 Unlock
Step: 3 Unlock

Students Have Also Explored These Related General Management Questions!