

Question: 1 3 . 8 More Open versus Closed Systems Figure 1 3 . 9 shows a closed queueing network and an open one. Job sizes
More Open versus Closed Systems
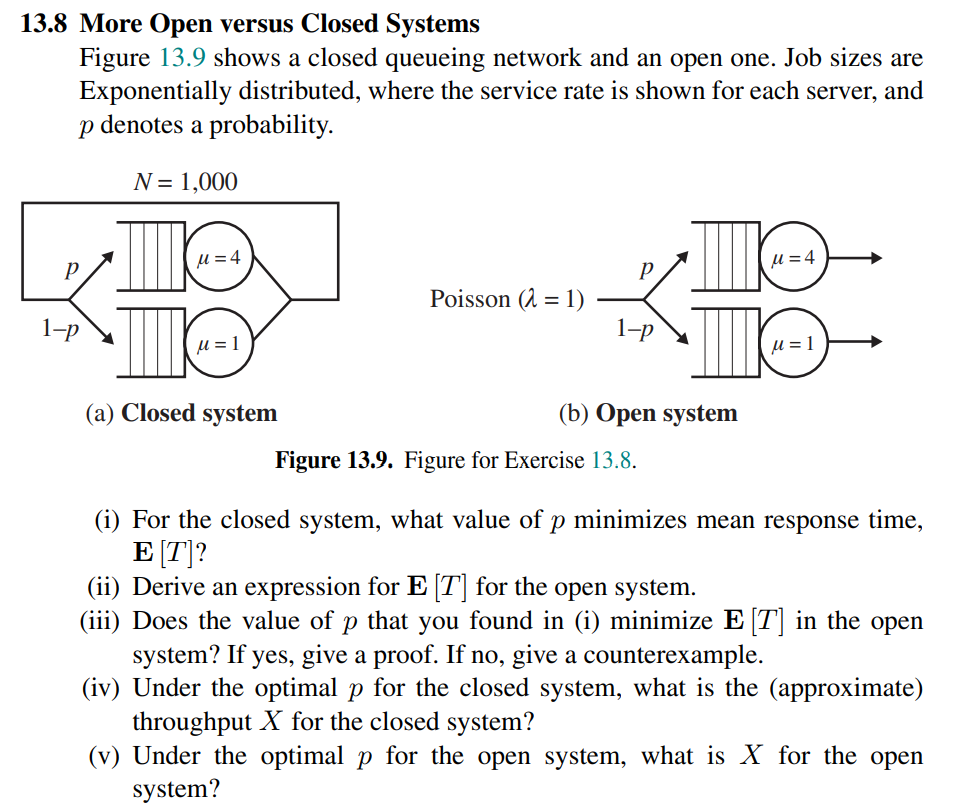
Figure shows a closed queueing network and an open one. Job sizes are Exponentially distributed, where the service rate is shown for each server, and p denotes a probability.
Figure Figure for Exercise
i For the closed system, what value of p minimizes mean response time, mathbfET
ii Derive an expression for mathbfET for the open system.
iii Does the value of p that you found in i minimize mathbfET in the open system? If yes, give a proof. If no give a counterexample.
iv Under the optimal p for the closed system, what is the approximate throughput X for the closed system?
v Under the optimal p for the open system, what is X for the open system?
Step by Step Solution
There are 3 Steps involved in it
1 Expert Approved Answer
Step: 1 Unlock

Question Has Been Solved by an Expert!
Get step-by-step solutions from verified subject matter experts
Step: 2 Unlock
Step: 3 Unlock