

Question: (1) (3 points) Draw a line graph of changes in the stock prices over time for each of the stock (paste both your codes and

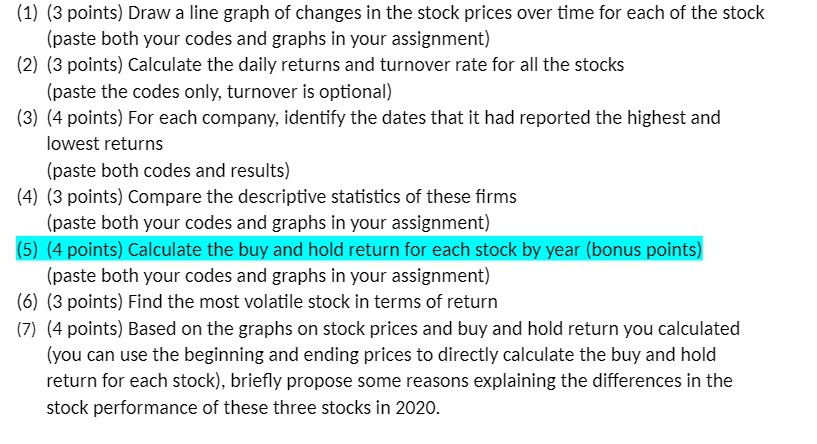
(1) (3 points) Draw a line graph of changes in the stock prices over time for each of the stock (paste both your codes and graphs in your assignment) (2) (3 points) Calculate the daily returns and turnover rate for all the stocks (paste the codes only, turnover is optional) (3) (4 points) For each company, identify the dates that it had reported the highest and lowest returns (paste both codes and results) (4) (3 points) Compare the descriptive statistics of these firms (paste both your codes and graphs in your assignment) (5) (4 points) Calculate the buy and hold return for each stock by year (bonus points) (paste both your codes and graphs in your assignment) (6) (3 points) Find the most volatile stock in terms of return (7) (4 points) Based on the graphs on stock prices and buy and hold return you calculated (you can use the beginning and ending prices to directly calculate the buy and hold return for each stock), briefly propose some reasons explaining the differences in the stock performance of these three stocks in 2020
Step by Step Solution
There are 3 Steps involved in it

Get step-by-step solutions from verified subject matter experts