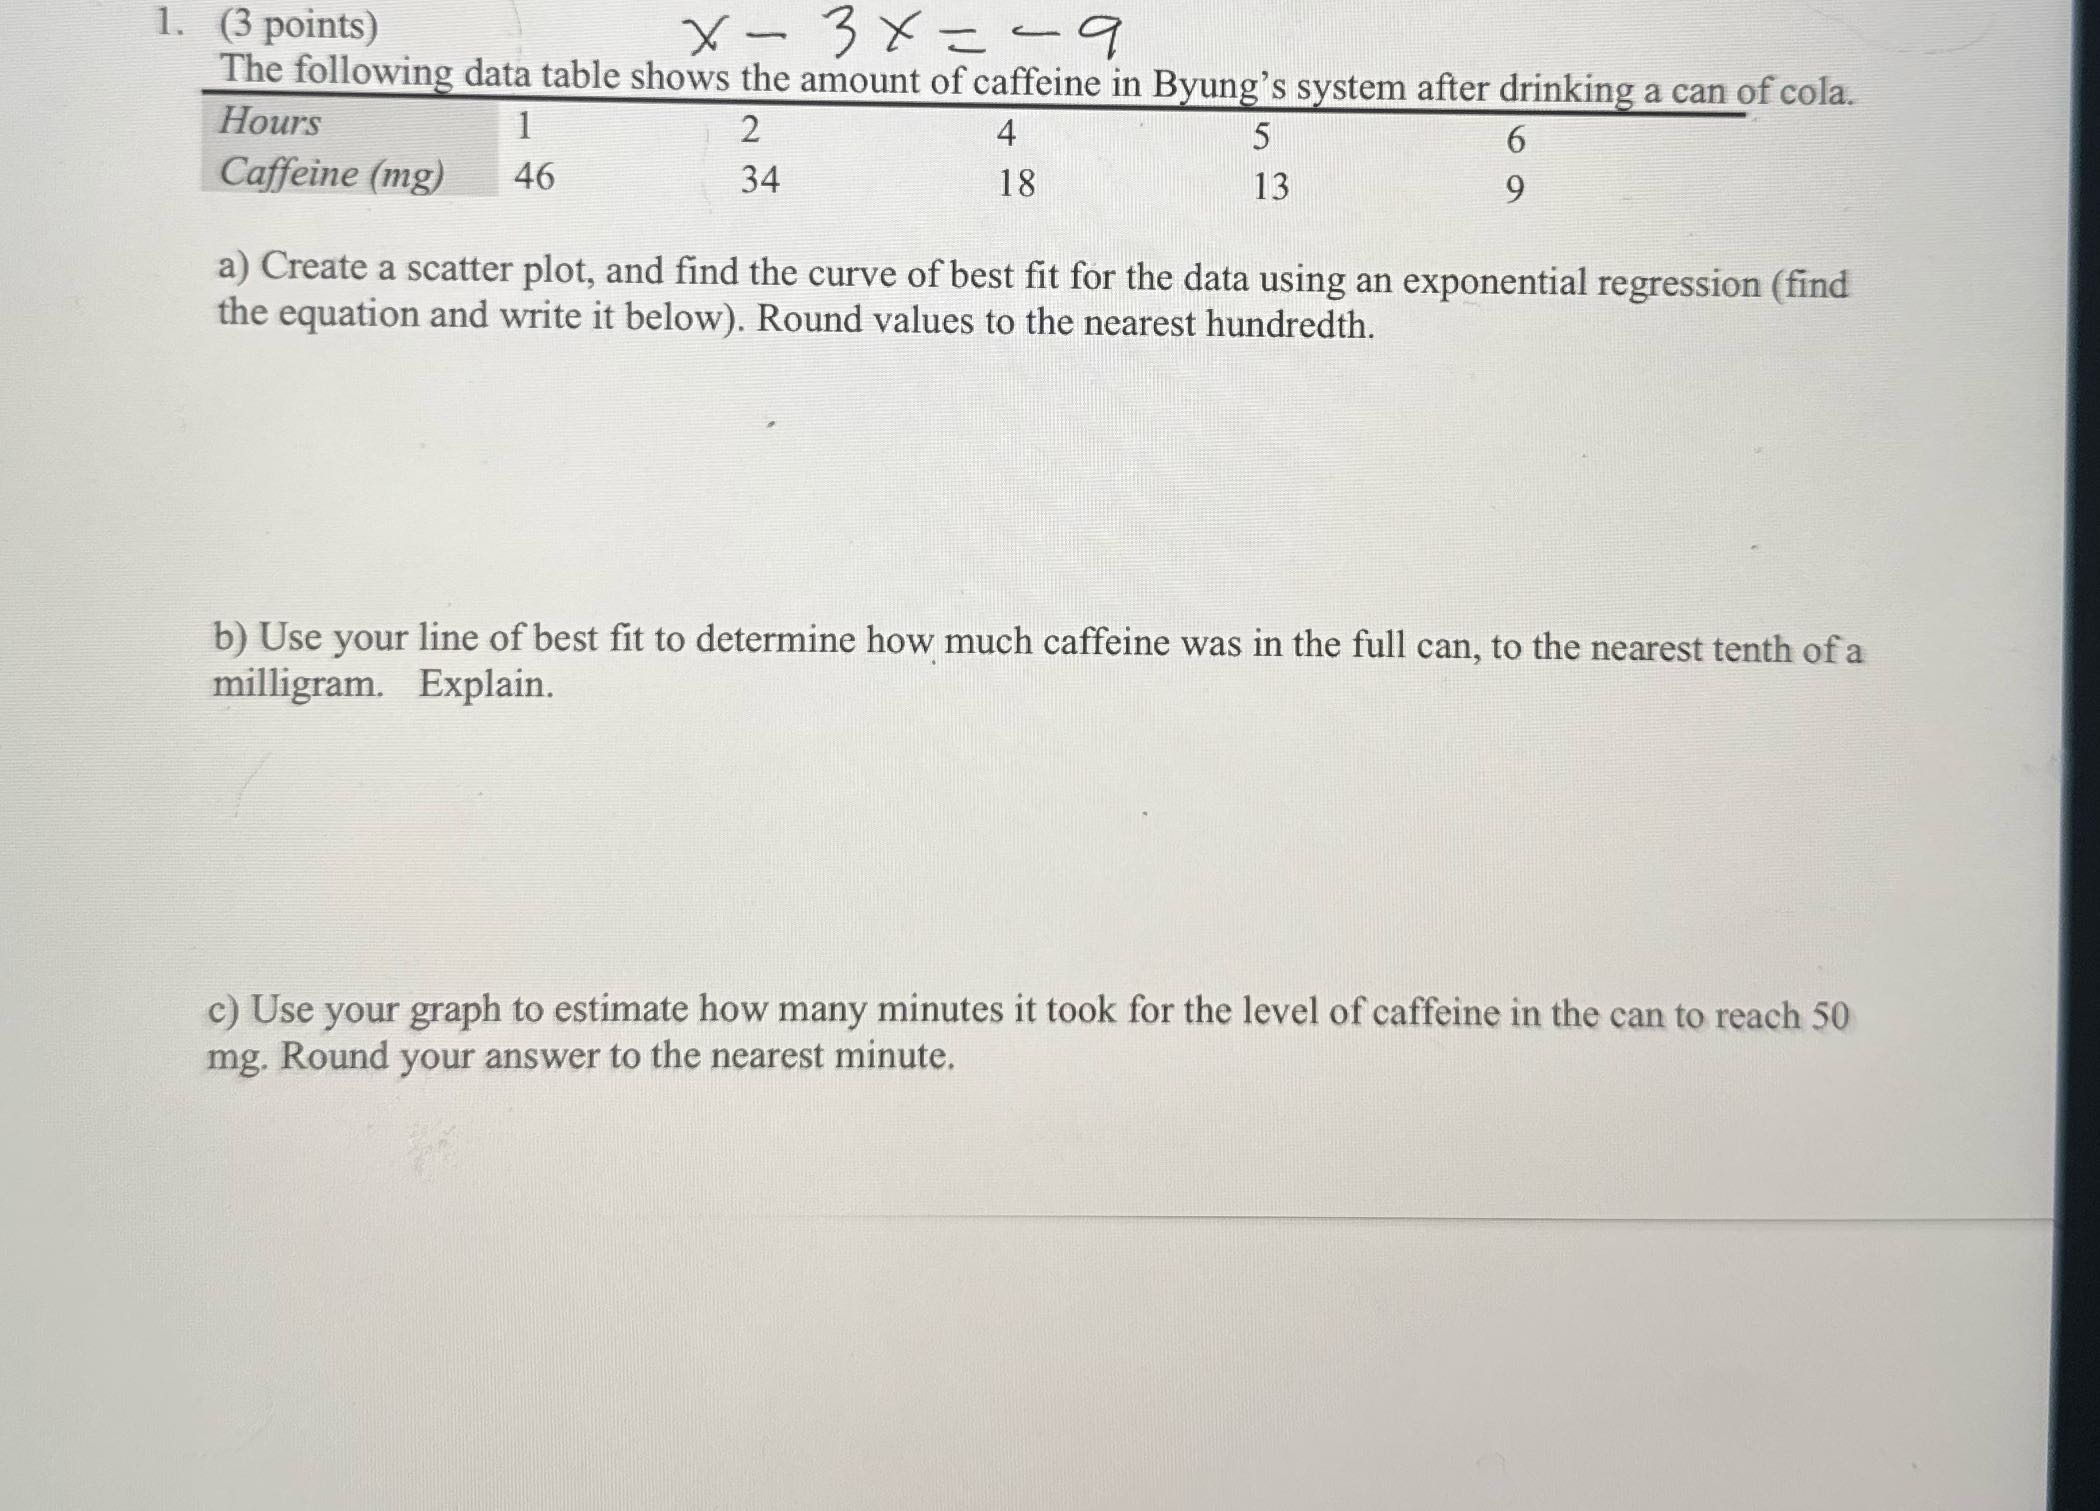
Question: 1. (3 points) X - 3% =-9 The following data table shows the amount of caffeine in Byung's system after drinking a can of cola.

1. (3 points) X - 3% =-9 The following data table
1. (3 points) X - 3% =-9 The following data table shows the amount of caffeine in Byung's system after drinking a can of cola. Hours 2 4 5 Caffeine (mg) 46 34 18 13 a) Create a scatter plot, and find the curve of best fit for the data using an exponential regression (find the equation and write it below). Round values to the nearest hundredth. b) Use your line of best fit to determine how much caffeine was in the full can, to the nearest tenth of a milligram. Explain. c) Use your graph to estimate how many minutes it took for the level of caffeine in the can to reach 50 mg. Round your answer to the nearest minute

Step by Step Solution

There are 3 Steps involved in it

1 Expert Approved Answer
Step: 1 Unlock blur-text-image
Question Has Been Solved by an Expert!

Get step-by-step solutions from verified subject matter experts

Step: 2 Unlock
Step: 3 Unlock

Students Have Also Explored These Related Accounting Questions!