

Question: Graphs of exponential and logarithmic function Name: ID: A 3. (5 points) The following data table shows the amount of caffeine in Byung's system after
Graphs of exponential and logarithmic function
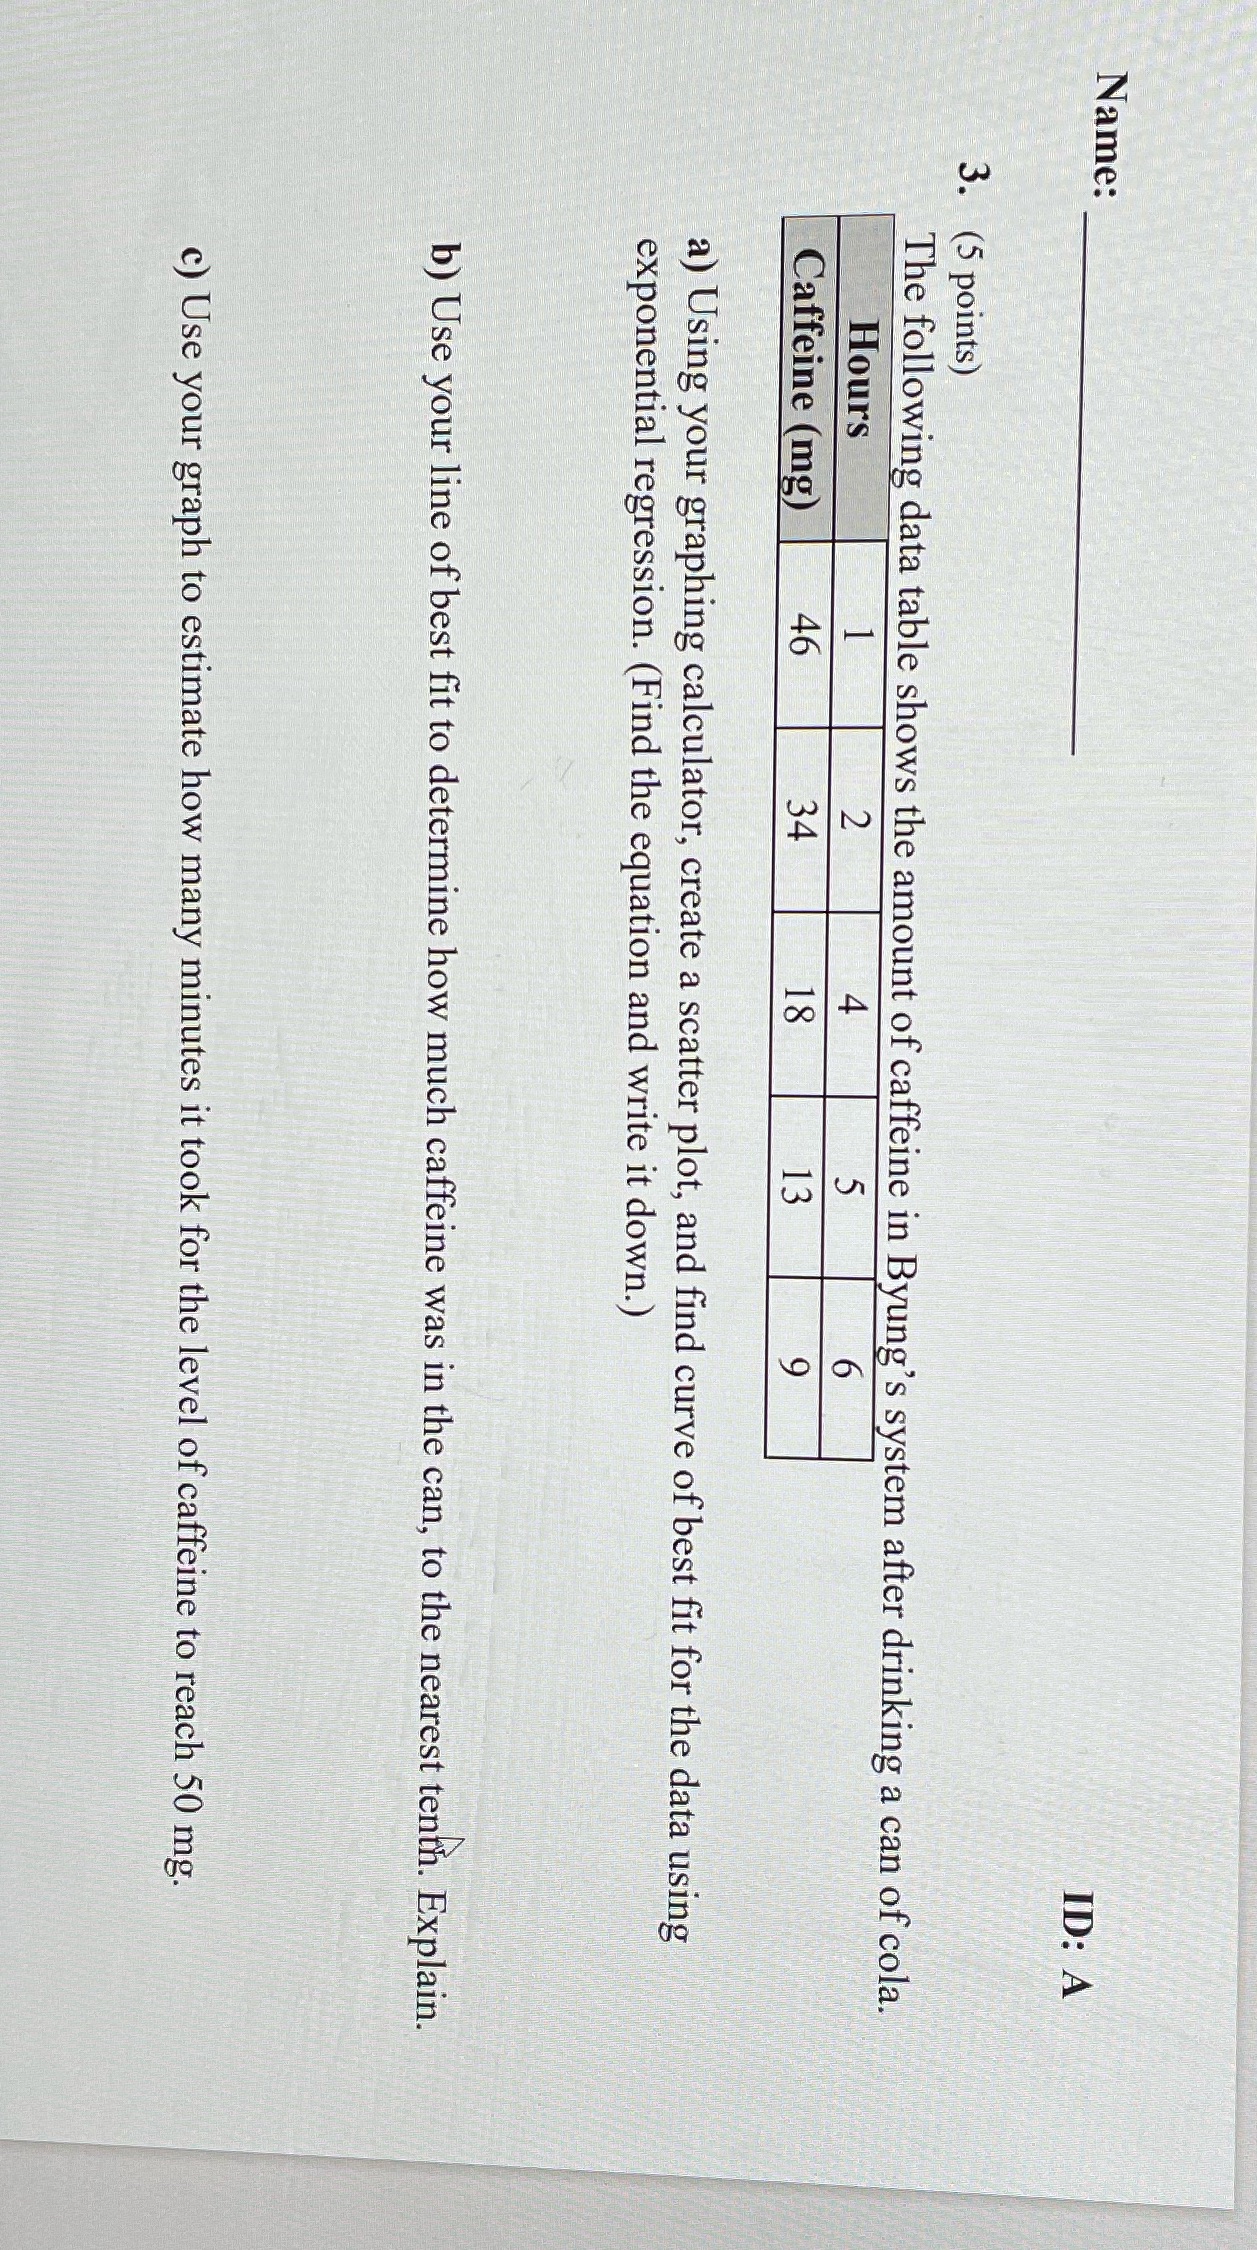
Name: ID: A 3. (5 points) The following data table shows the amount of caffeine in Byung's system after drinking a can of cola. Hours + go Caffeine (mg) a) Using your graphing calculator, create a scatter plot, and find curve of best fit for the data using exponential regression. (Find the equation and write it down. ) b) Use your line of best fit to determine how much caffeine was in the can, to the nearest tenth. Explain. c) Use your graph to estimate how many minutes it took for the level of caffeine to reach 50 mg
Step by Step Solution
There are 3 Steps involved in it
1 Expert Approved Answer
Step: 1 Unlock

Question Has Been Solved by an Expert!
Get step-by-step solutions from verified subject matter experts
Step: 2 Unlock
Step: 3 Unlock