

Question: 1 4 . 6 Consider the data shown in Fig. 1 4 . 3 7 of the group delay versus wavelength for a 1 0
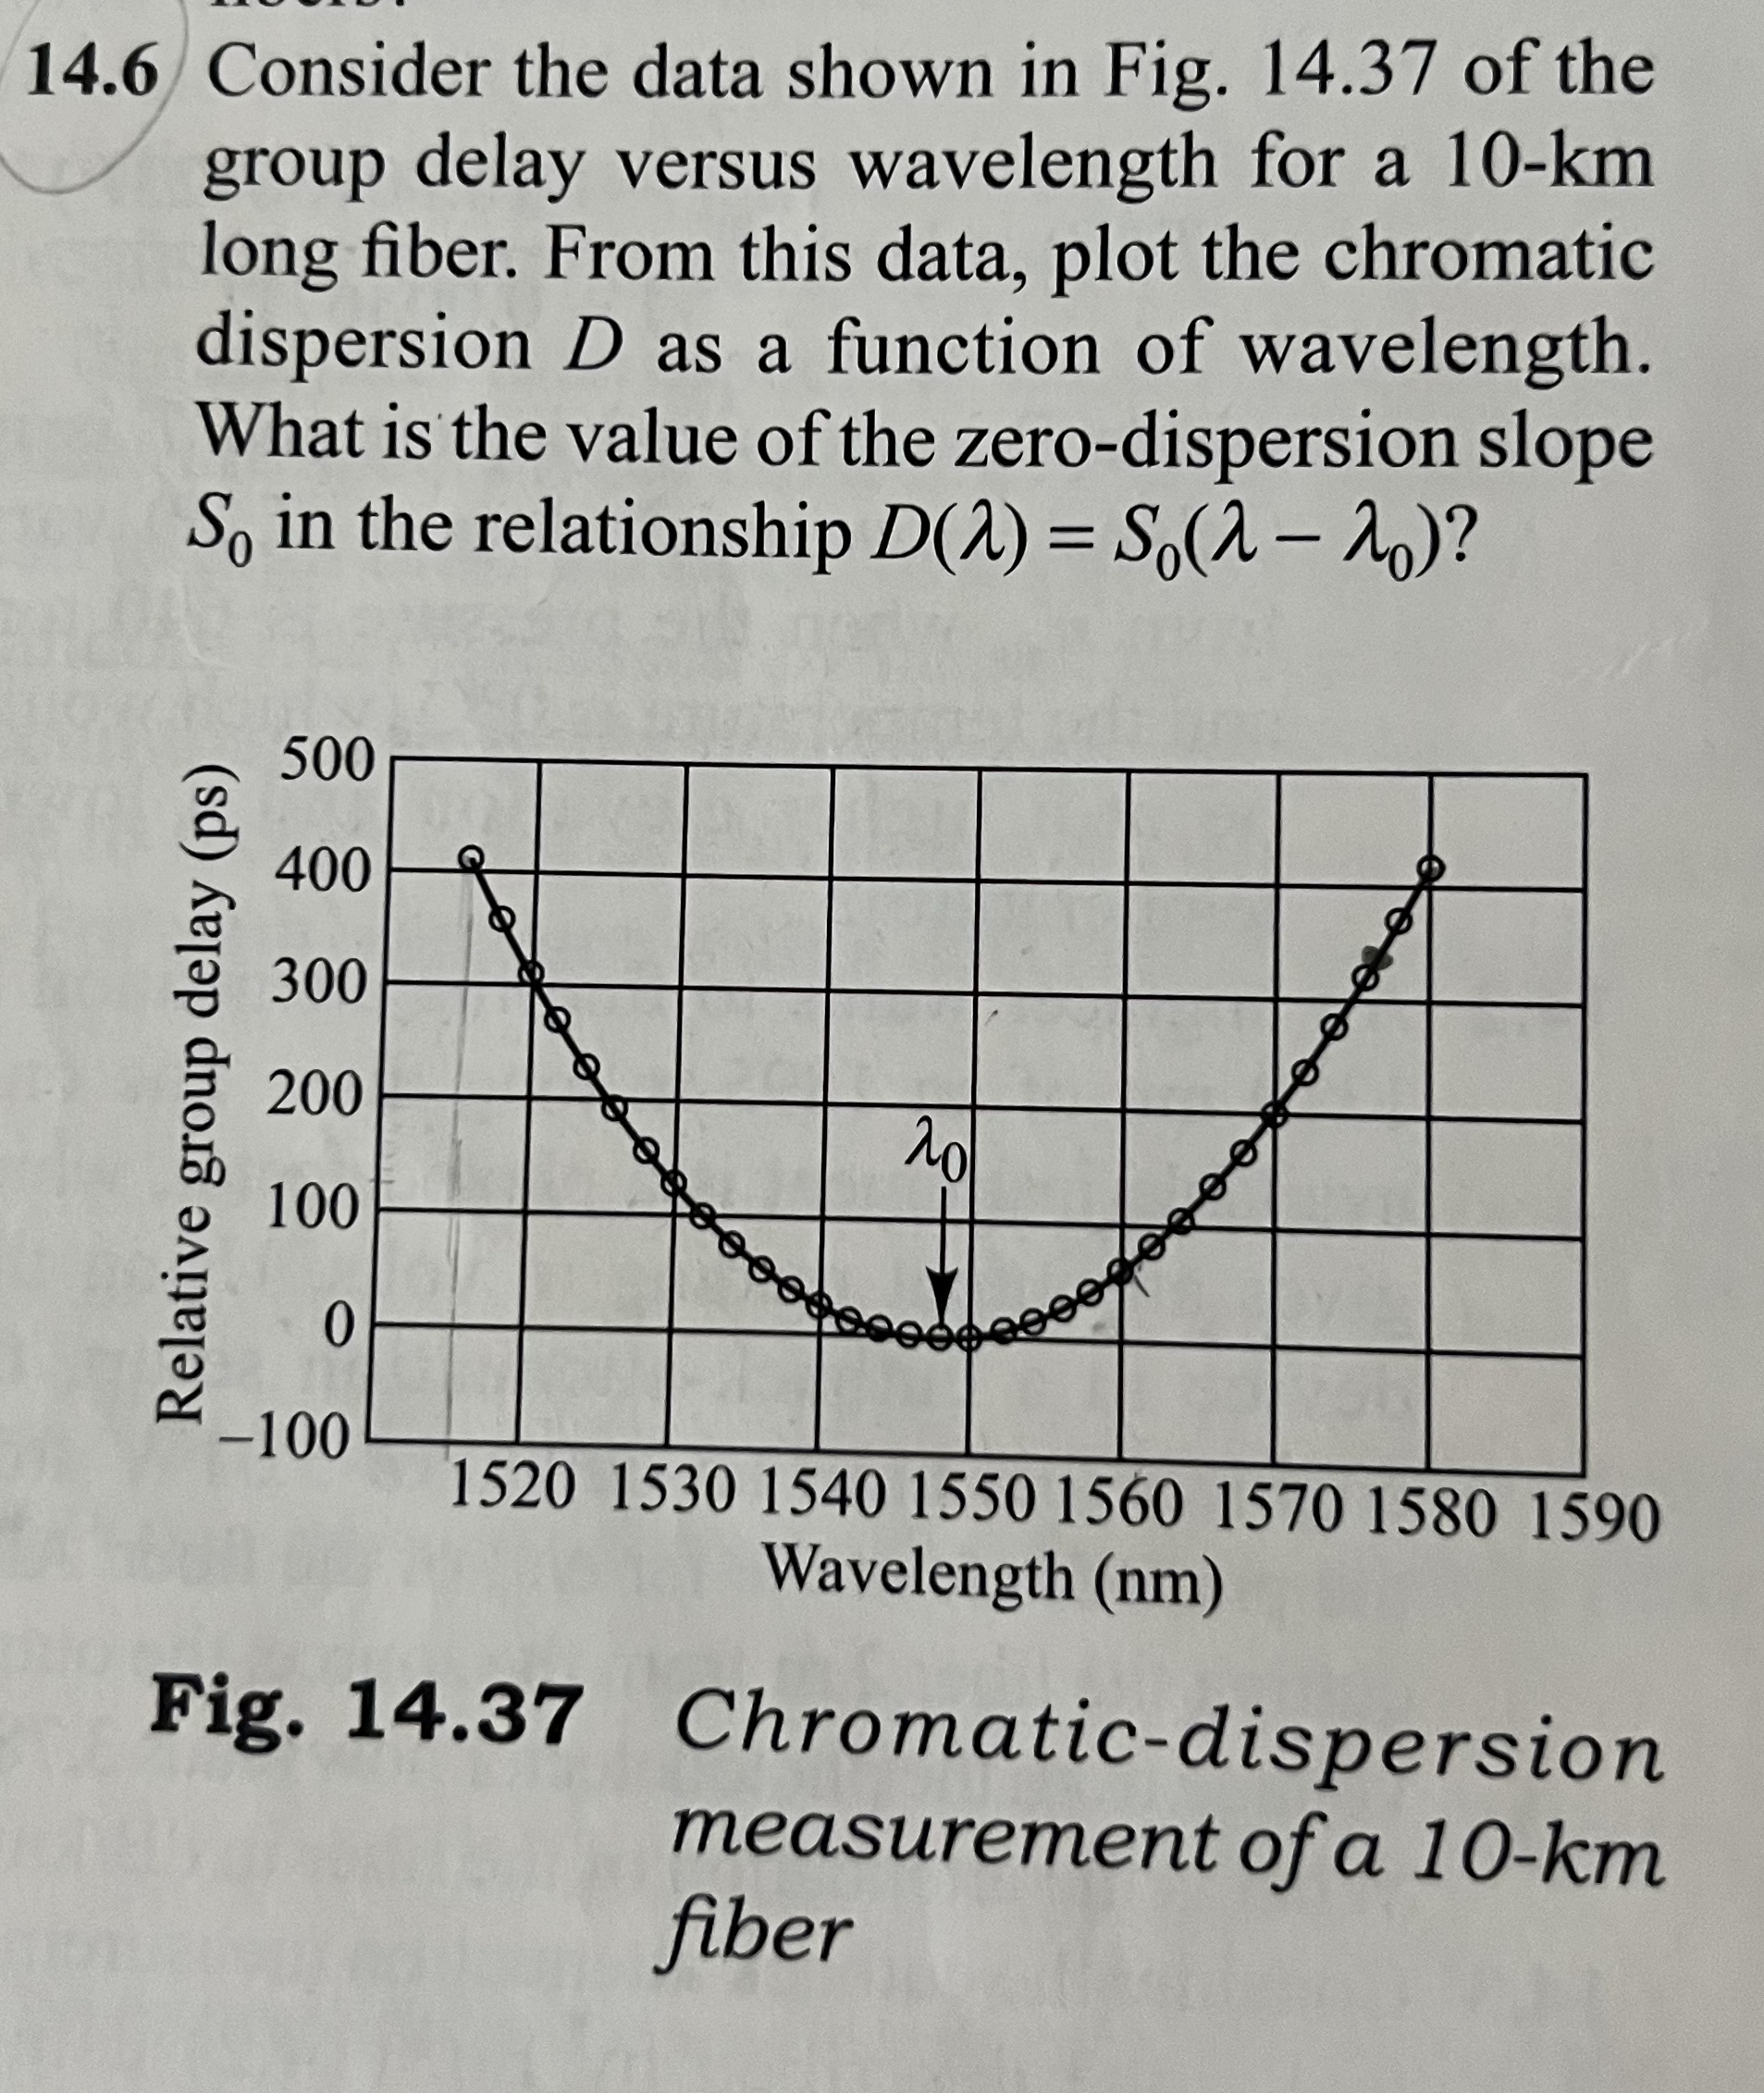
Consider the data shown in Fig. of the group delay versus wavelength for a long fiber. From this data, plot the chromatic dispersion as a function of wavelength. What is the value of the zerodispersion slope in the relationship
Fig. Chromaticdispersion measurement of a fiber
Step by Step Solution
There are 3 Steps involved in it
1 Expert Approved Answer
Step: 1 Unlock

Question Has Been Solved by an Expert!
Get step-by-step solutions from verified subject matter experts
Step: 2 Unlock
Step: 3 Unlock