

Question: 1 5) Demand for Labor Function 100 90 80 8 8 Real Wage 50 30 20 10 o 70,000 40,000 20,000 30,000 50,000 80,000 60,000
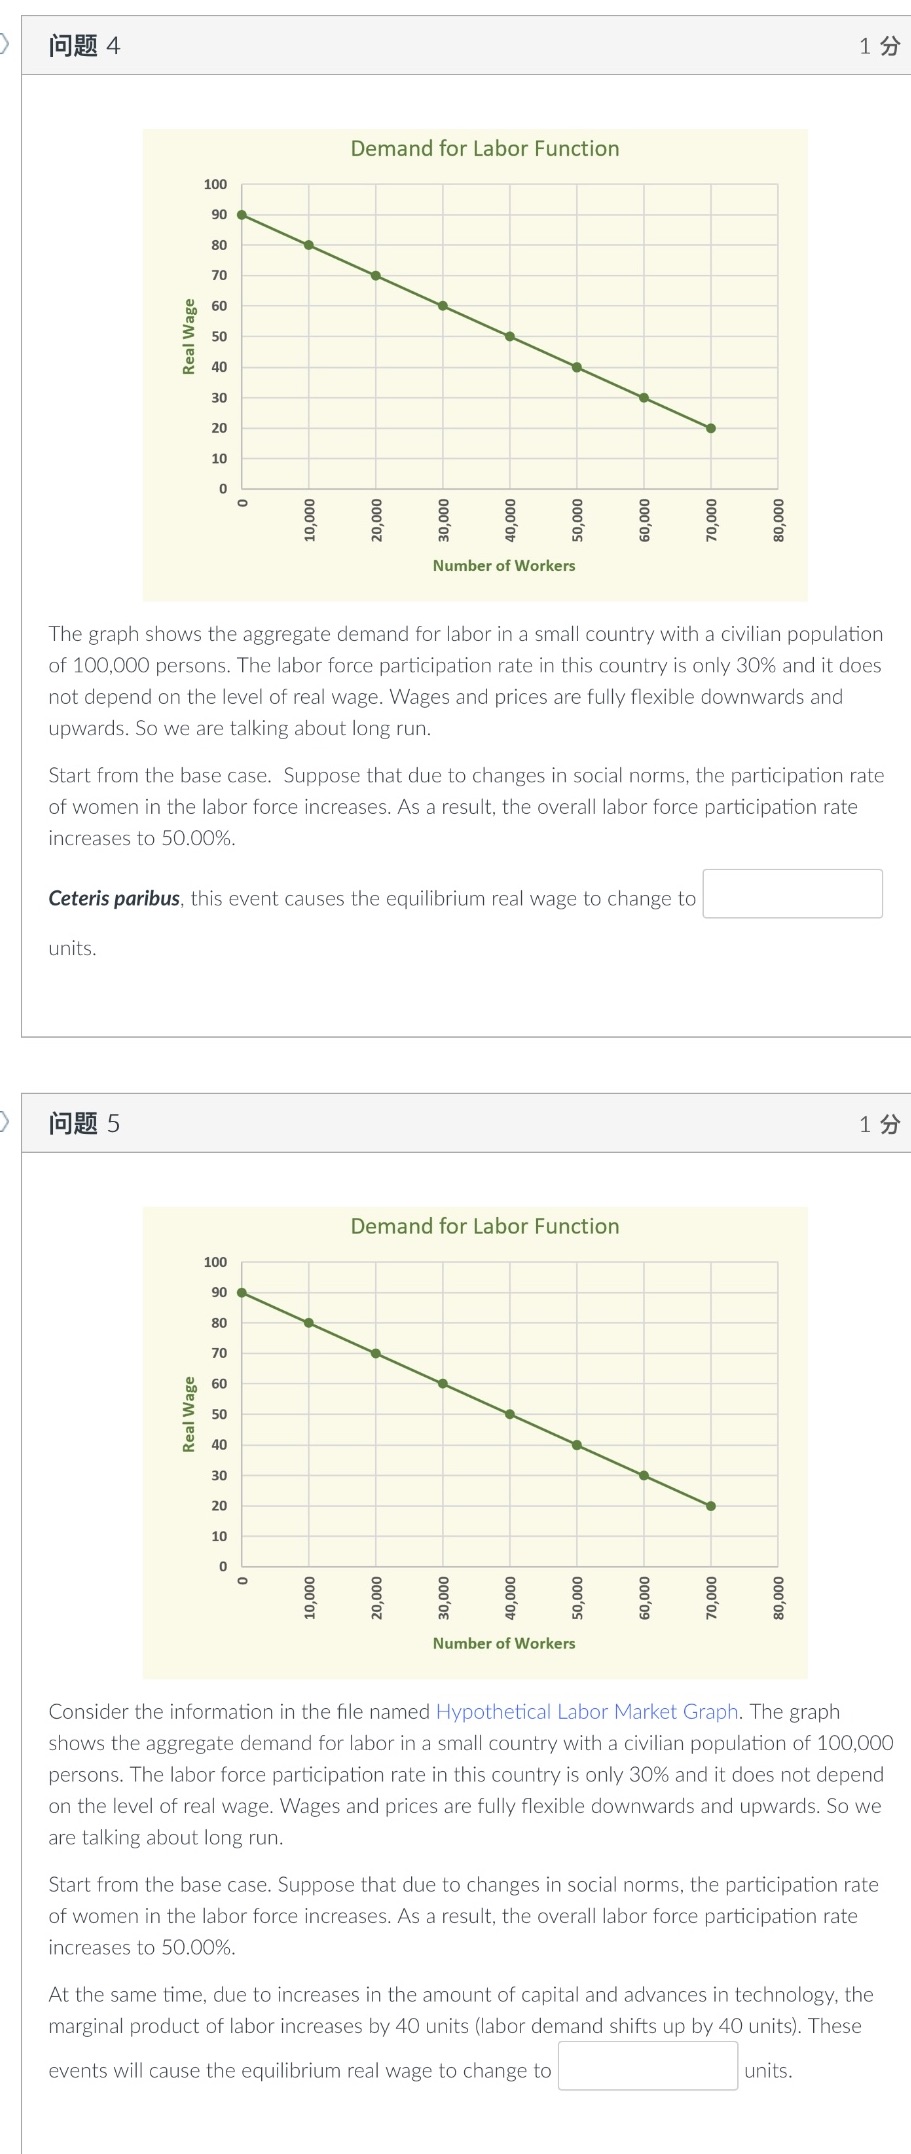
1 5) Demand for Labor Function 100 90 80 8 8 Real Wage 50 30 20 10 o 70,000 40,000 20,000 30,000 50,000 80,000 60,000 10,000 Number of Workers The graph shows the aggregate demand for labor in a small country with a civilian population of 100,000 persons. The labor force participation rate in this country is only 30% and it does not depend on the level of real wage. Wages and prices are fully flexible downwards and upwards. So we are talking about long run. Start from the base case. Suppose that due to changes in social norms, the participation rate of women in the labor force increases. As a result, the overall labor force participation rate increases to 50.00%. Ceteris paribus, this event causes the equilibrium real wage to change to units. 1 5) Demand for Labor Function 100 90 80 70 60 Real Wage 5 8 8 8 8 10 O 50,000 60,000 70,000 40,000 20,000 30,000 80,000 10,000 Number of Workers Consider the information in the file named Hypothetical Labor Market Graph. The graph shows the aggregate demand for labor in a small country with a civilian population of 100,000 persons. The labor force participation rate in this country is only 30% and it does not depend on the level of real wage. Wages and prices are fully flexible downwards and upwards. So we are talking about long run. Start from the base case. Suppose that due to changes in social norms, the participation rate of women in the labor force increases. As a result, the overall labor force participation rate increases to 50.00%. At the same time, due to increases in the amount of capital and advances in technology, the marginal product of labor increases by 40 units (labor demand shifts up by 40 units). These events will cause the equilibrium real wage to change to units
Step by Step Solution
There are 3 Steps involved in it

Get step-by-step solutions from verified subject matter experts