

Question: 1. [5 points] Covers chapter 3. Consider the table below. It shows the production (output) obtained as the # of workers rises. For example, when
![1. [5 points] Covers chapter 3. Consider the table below. It](https://s3.amazonaws.com/si.experts.images/answers/2024/06/667b5d17ccdc6_791667b5d17a934a.jpg)
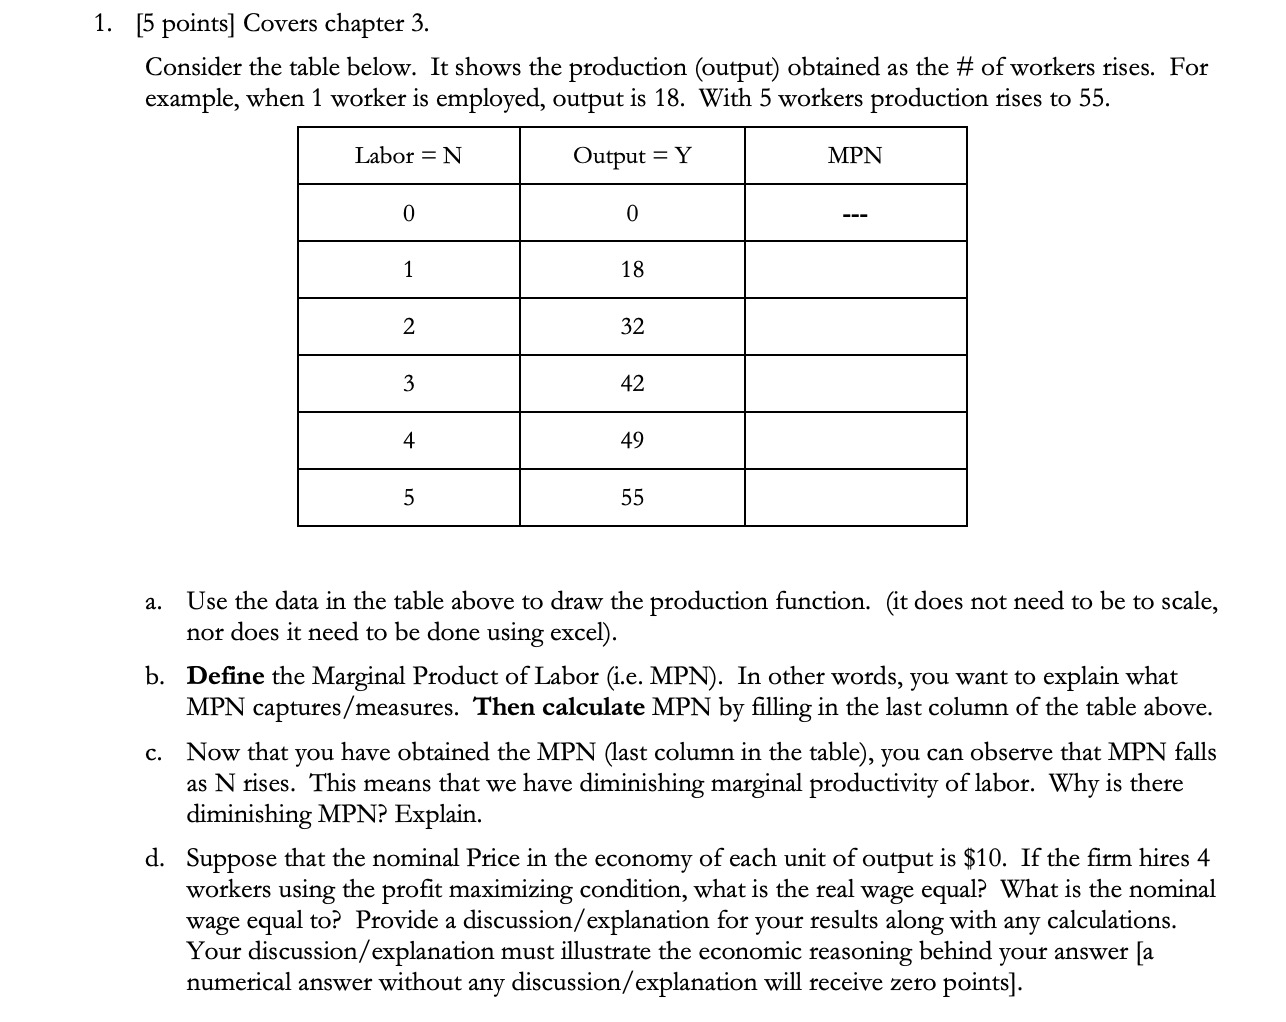
1. [5 points] Covers chapter 3. Consider the table below. It shows the production (output) obtained as the # of workers rises. For example, when 1 worker is employed, output is 18. With 5 workers production rises to 55. a. Use the data in the table above to draw the production function. (it does not need to be to scale, nor does it need to be done using excel). Dene the Marginal Product of Labor (i.e. MPN). In other words, you want to explain what MPN captures / measures. Then calculate MPN by lling in the last column of the table above. Now that you have obtained the M'PN (last column in the table), you can observe that NIPN falls as N rises. This means that we have diminishing marginal productivity of labor. Why is there (lllTJJIll- ' 'shing MPN? Explain. Suppose that the nominal Price in the economy of each unit of output is $10. If the rm hires 4 workers using the prot maximizing condition, what is the real wage equal? 1What is the nominal wage equal to? Provide a discussion/ explanation for your results along with any calculations. Your discussion/ explanation must illustrate the economic reasoning behind your answer [a numerical answer without any discussion/ explanation will receive zero points]
Step by Step Solution
There are 3 Steps involved in it

Get step-by-step solutions from verified subject matter experts