

Question: 1. Draw the network that represents the companys distribution network. 2. What is the transportation strategy (number of each product shipped from each plant to
1. Draw the network that represents the company’s distribution network.
2. What is the transportation strategy (number of each product shipped from each plant to each warehouse, and from each warehouse to each retailer) that minimizes the total cost? Mathematically formulate this problem (indicating sets, parameters, decision variables, objective function, and constraints) and solve it using Excel or Gurobi. Show your results clearly and discuss.
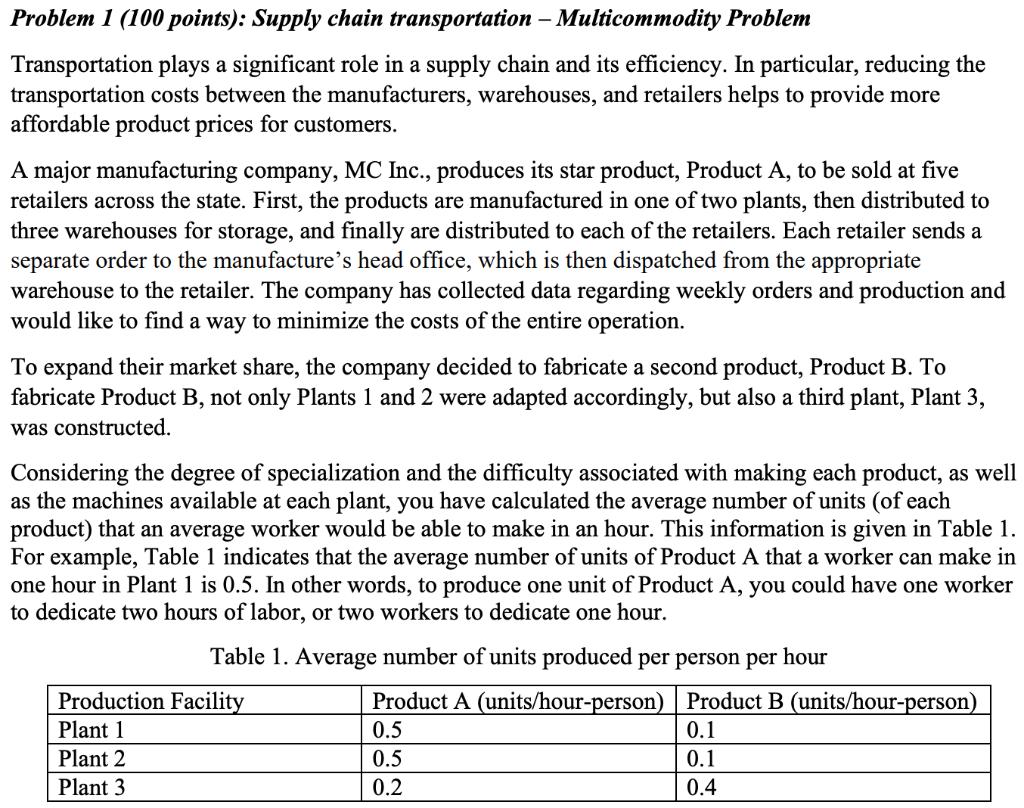
Problem 1 (100 points): Supply chain transportation - Multicommodity Problem Transportation plays a significant role in a supply chain and its efficiency. In particular, reducing the transportation costs between the manufacturers, warehouses, and retailers helps to provide more affordable product prices for customers. A major manufacturing company, MC Inc., produces its star product, Product A, to be sold at five retailers across the state. First, the products are manufactured in one of two plants, then distributed to three warehouses for storage, and finally are distributed to each of the retailers. Each retailer sends a separate order to the manufacture's head office, which is then dispatched from the appropriate warehouse to the retailer. The company has collected data regarding weekly orders and production and would like to find a way to minimize the costs of the entire operation. To expand their market share, the company decided to fabricate a second product, Product B. To fabricate Product B, not only Plants 1 and 2 were adapted accordingly, but also a third plant, Plant 3, was constructed. Considering the degree of specialization and the difficulty associated with making each product, as well as the machines available at each plant, you have calculated the average number of units (of each product) that an average worker would be able to make in an hour. This information is given in Table 1. For example, Table 1 indicates that the average number of units of Product A that a worker can make in one hour in Plant 1 is 0.5. In other words, to produce one unit of Product A, you could have one worker to dedicate two hours of labor, or two workers to dedicate one hour. Table 1. Average number of units produced per person per hour Production Facility Plant 1 Plant 2 Plant 3 Product A (units/hour-person)| Product B (units/hour-person) 0.5 0.1 0.5 0.1 0.2 0.4
Step by Step Solution
3.48 Rating (151 Votes )
There are 3 Steps involved in it
1 Network diagram showing companys distribution network ... View full answer

Get step-by-step solutions from verified subject matter experts