

Question: ( 1 5 points ) The two - week MPS figures for products A and B are given in the table below. table [
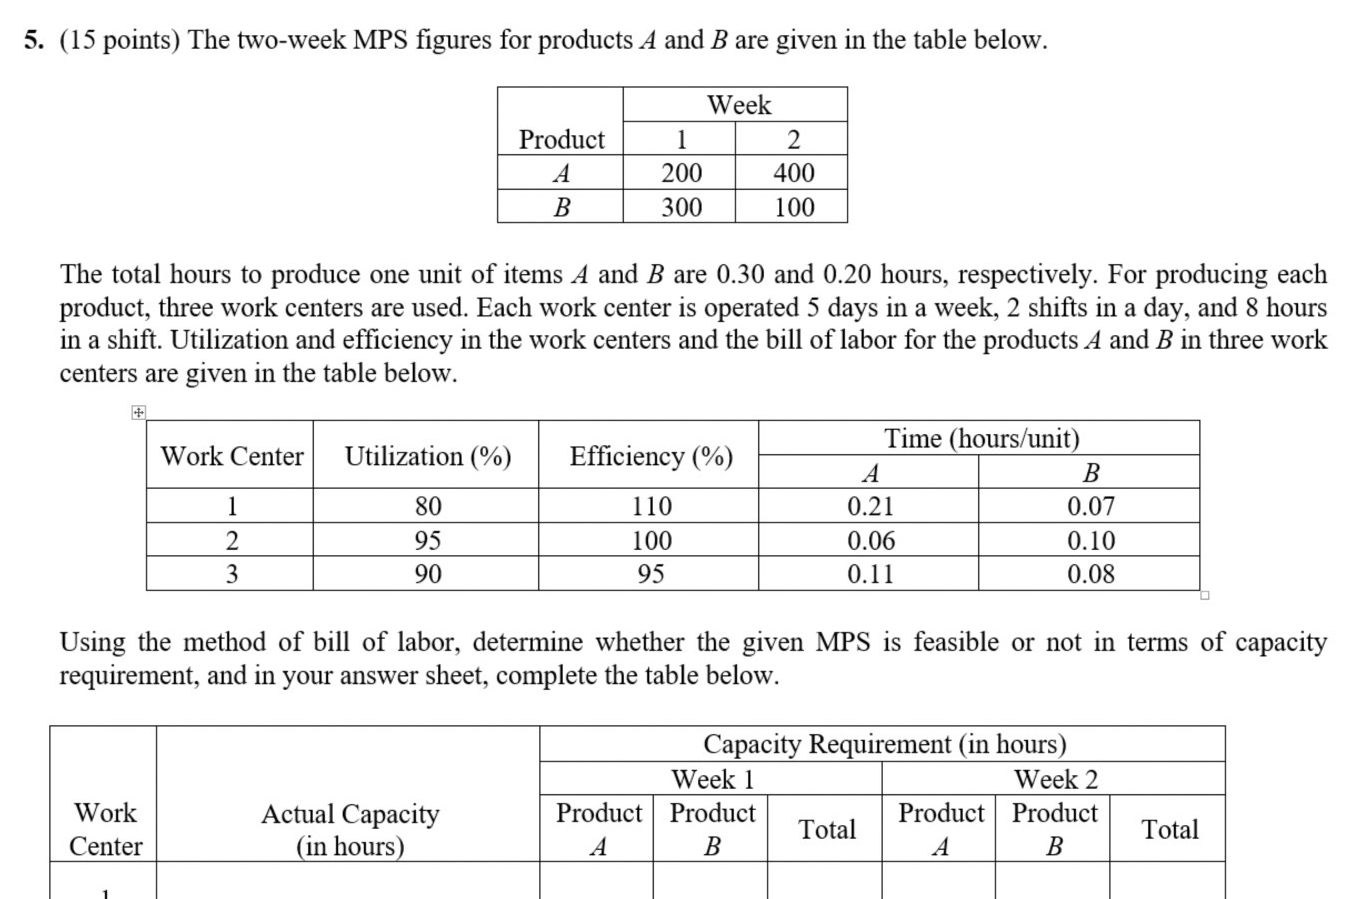
points The twoweek MPS figures for products A and are given in the table below.
tableProductWeek
The total hours to produce one unit of items A and are and hours, respectively. For producing each product, three work centers are used. Each work center is operated days in a week, shifts in a day, and hours in a shift. Utilization and efficiency in the work centers and the bill of labor for the products A and in three work centers are given in the table below.
tableWork Center,Utilization Efficiency Time hoursunit
Step by Step Solution
There are 3 Steps involved in it
1 Expert Approved Answer
Step: 1 Unlock

Question Has Been Solved by an Expert!
Get step-by-step solutions from verified subject matter experts
Step: 2 Unlock
Step: 3 Unlock