

Question: 1 7 . 1 0 Constructing another Pareto chart. A large hospital finds that it is losing money on surgery due to inadequate reimbursement by
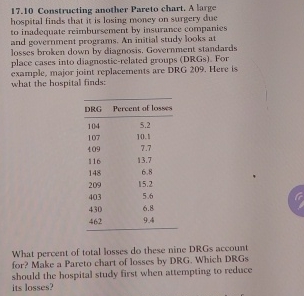
Constructing another Pareto chart. A large hospital finds that it is losing money on surgery due to inadequate reimbursement by insurance companies and government programs. An initial study looks at losses broken down by diagnosis. Government standards place cases into diagnosticrelated groups DRGs For example, major joint replacements are DRG Here is what the hospital finds:
tableDRGPercent of losses
What percent of total losses do these nine DRGs account for? Make a Pareto chart of losses by DRG Which DRGs should the hospital study first when attempting to reduce its losses?
Step by Step Solution
There are 3 Steps involved in it
1 Expert Approved Answer
Step: 1 Unlock

Question Has Been Solved by an Expert!
Get step-by-step solutions from verified subject matter experts
Step: 2 Unlock
Step: 3 Unlock